
| Export of goods from Finland and import to Finland | BEC (Broad Economic Categories) |
*) The standard of statistical classification of BEC (Broad Economic Categories) is upheld by the UN and it is based on SITC-nomenclature.

| 2021 | 2022 | 2023 | 2024 | 2025 | ||||||
|---|---|---|---|---|---|---|---|---|---|---|
| 1,000 € | % | 1,000 € | % | 1,000 € | % | 1,000 € | % | 1,000 € | % | |
| 1. Food and beverages | 2,273 | 4.6 | 225 | 0.4 | 260 | 0.5 | 187 | 0.3 | 848 | 1.5 |
| 11. Food and beverages, primary | 2,144 | 4.3 | ||||||||
| 111. Food and beverages, primary, mainly for industry | 2,144 | 4.3 | ||||||||
| 12. Food and beverages, processed | 129 | 0.3 | 225 | 0.4 | 260 | 0.5 | 187 | 0.3 | 848 | 1.5 |
| 121. Food and beverages, processed, mainly for industry | 93 | 0.2 | 80 | 0.1 | 71 | 0.1 | 67 | 0.1 | 124 | 0.2 |
| 122. Food and beverages, processed, mainly for household consumption | 36 | 0.1 | 145 | 0.2 | 189 | 0.4 | 120 | 0.2 | 724 | 1.3 |
| 2. Industrial supplies not elsewhere specified | 36,826 | 74.3 | 48,445 | 80.6 | 38,127 | 77.4 | 40,568 | 75.3 | 40,449 | 72.0 |
| 21. Industrial supplies not elsewhere specified, primary | 444 | 0.9 | 6 | 0.0 | ||||||
| 22. Industrial supplies not elsewhere specified, processed | 36,826 | 74.3 | 48,445 | 80.6 | 37,683 | 76.5 | 40,568 | 75.3 | 40,442 | 72.0 |
| 3. Fuels and lubricants | 2,004 | 4.0 | 531 | 0.9 | ||||||
| 31. Fuels and lubricants, primary | 2,004 | 4.0 | 530 | 0.9 | ||||||
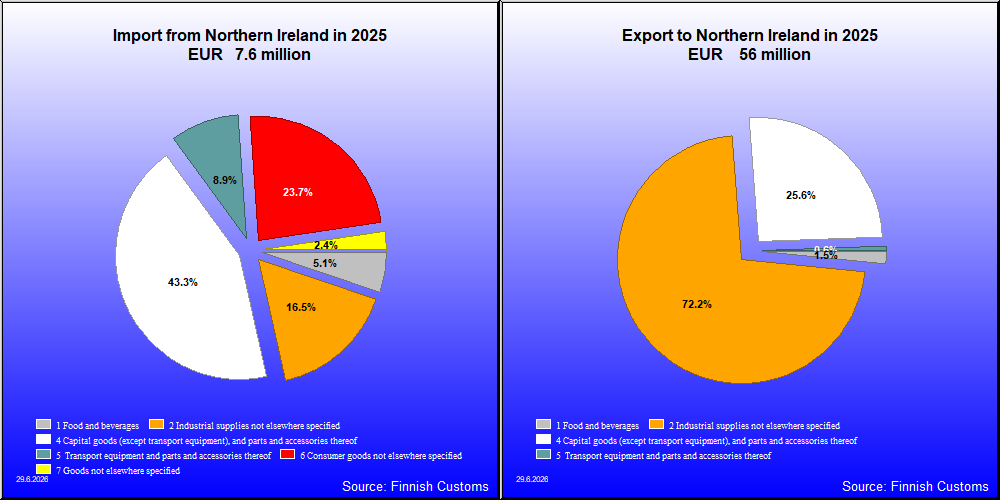
| 4. Capital goods (except transport equipment), and parts and accessories thereof | 6,026 | 12.2 | 8,307 | 13.8 | 10,074 | 20.5 | 11,016 | 20.4 | 14,351 | 25.6 |
| 41. Capital goods (except transport equipment) | 4,521 | 9.1 | 7,478 | 12.4 | 6,648 | 13.5 | 6,920 | 12.8 | 4,637 | 8.3 |
| 42. Capital goods (except transport equipment), parts and accessories | 1,505 | 3.0 | 829 | 1.4 | 3,427 | 7.0 | 4,095 | 7.6 | 9,714 | 17.3 |
| 5. Transport equipment and parts and accessories thereof | 184 | 0.4 | 390 | 0.6 | 271 | 0.6 | 1,901 | 3.5 | 340 | 0.6 |
| 51. Passenger motor vehicles | 608 | 1.1 | 6 | 0.0 | ||||||
| 52. Transport equipment, other than passenger motor vehicles | 27 | 0.1 | 103 | 0.2 | 117 | 0.2 | 1,007 | 1.9 | 25 | 0.0 |
| 521. Transport equipment, other than passenger motor vehicles, industrial | 11 | 0.0 | 58 | 0.1 | 1,007 | 1.9 | 25 | 0.0 | ||
| 522. Transport equipment, other than passenger motor vehicles, non-industrial | 27 | 0.1 | 92 | 0.2 | 59 | 0.1 | ||||
| 53. Transport equipment, parts and accessories | 157 | 0.3 | 287 | 0.5 | 154 | 0.3 | 287 | 0.5 | 309 | 0.5 |
| 6. Consumer goods not elsewhere specified | 93 | 0.2 | 145 | 0.2 | 285 | 0.6 | 144 | 0.3 | 146 | 0.3 |
| 61. Consumer goods not elsewhere specified, durable | 1 | 0.0 | 4 | 0.0 | 1 | 0.0 | 1 | 0.0 | ||
| 62. Consumer goods not elsewhere specified, semi-durable | 88 | 0.2 | 137 | 0.2 | 245 | 0.5 | 134 | 0.2 | 131 | 0.2 |
| 63. Consumer goods not elsewhere specified, non-durable | 5 | 0.0 | 6 | 0.0 | 37 | 0.1 | 9 | 0.0 | 14 | 0.0 |
| 7. Goods not elsewhere specified | 2,153 | 4.3 | 2,646 | 4.4 | 213 | 0.4 | 54 | 0.1 | 24 | 0.0 |
| All groups | 49,559 | 100.0 | 60,113 | 100.0 | 49,229 | 100.0 | 53,871 | 100.0 | 56,158 | 100.0 |
| 2021 | 2022 | 2023 | 2024 | 2025 | ||||||
|---|---|---|---|---|---|---|---|---|---|---|
| 1,000 € | % | 1,000 € | % | 1,000 € | % | 1,000 € | % | 1,000 € | % | |
| 1. Food and beverages | 30 | 0.1 | 388 | 5.1 | ||||||
| 12. Food and beverages, processed | 30 | 0.1 | 388 | 5.1 | ||||||
| 121. Food and beverages, processed, mainly for industry | 339 | 4.5 | ||||||||
| 122. Food and beverages, processed, mainly for household consumption | 30 | 0.1 | 48 | 0.6 | ||||||
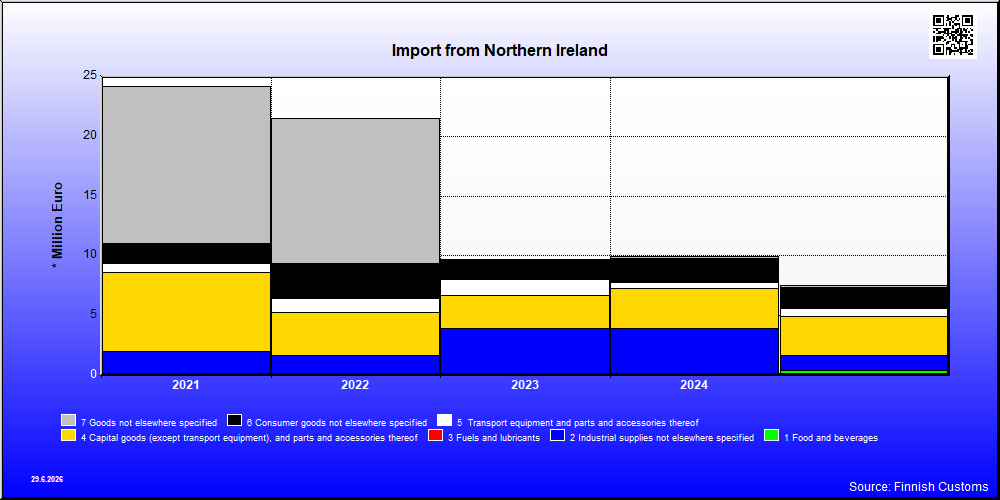
| 2. Industrial supplies not elsewhere specified | 1,994 | 8.2 | 1,668 | 8.7 | 3,951 | 40.7 | 3,946 | 39.8 | 1,245 | 16.5 |
| 21. Industrial supplies not elsewhere specified, primary | 3 | 0.0 | ||||||||
| 22. Industrial supplies not elsewhere specified, processed | 1,991 | 8.2 | 1,668 | 8.7 | 3,951 | 40.7 | 3,946 | 39.8 | 1,245 | 16.5 |
| 4. Capital goods (except transport equipment), and parts and accessories thereof | 6,591 | 27.3 | 3,578 | 18.8 | 2,715 | 28.0 | 3,287 | 33.1 | 3,278 | 43.3 |
| 41. Capital goods (except transport equipment) | 5,109 | 21.1 | 2,689 | 14.1 | 2,248 | 23.2 | 2,678 | 27.0 | 2,674 | 35.4 |
| 42. Capital goods (except transport equipment), parts and accessories | 1,482 | 6.1 | 889 | 4.7 | 467 | 4.8 | 609 | 6.1 | 605 | 8.0 |
| 5. Transport equipment and parts and accessories thereof | 773 | 3.2 | 1,173 | 6.1 | 1,337 | 13.8 | 565 | 5.7 | 672 | 8.9 |
| 52. Transport equipment, other than passenger motor vehicles | 421 | 1.7 | 874 | 4.6 | 1,232 | 12.7 | 562 | 5.7 | 619 | 8.2 |
| 521. Transport equipment, other than passenger motor vehicles, industrial | 421 | 1.7 | 874 | 4.6 | 1,232 | 12.7 | 560 | 5.6 | 619 | 8.2 |
| 522. Transport equipment, other than passenger motor vehicles, non-industrial | 2 | 0.0 | ||||||||
| 53. Transport equipment, parts and accessories | 352 | 1.5 | 299 | 1.6 | 105 | 1.1 | 3 | 0.0 | 53 | 0.7 |
| 6. Consumer goods not elsewhere specified | 1,683 | 7.0 | 2,927 | 15.3 | 1,701 | 17.5 | 1,998 | 20.1 | 1,796 | 23.7 |
| 61. Consumer goods not elsewhere specified, durable | 1 | 0.0 | 65 | 0.3 | 171 | 1.8 | 299 | 3.0 | 126 | 1.7 |
| 62. Consumer goods not elsewhere specified, semi-durable | 829 | 3.4 | 1,049 | 5.5 | 1,026 | 10.6 | 920 | 9.3 | 885 | 11.7 |
| 63. Consumer goods not elsewhere specified, non-durable | 853 | 3.5 | 1,813 | 9.5 | 504 | 5.2 | 778 | 7.8 | 786 | 10.4 |
| 7. Goods not elsewhere specified | 13,099 | 54.2 | 12,164 | 63.8 | 131 | 1.3 | 184 | 2.4 | ||
| All groups | 24,170 | 100.0 | 19,073 | 100.0 | 9,704 | 100.0 | 9,926 | 100.0 | 7,563 | 100.0 |
| Classification | Description | Year level | Quarter level | Month level | |
|---|---|---|---|---|---|
| SITC | Standard International Trade Classification (classification system is maintained by the United Nations) | ███ | ███ | ███ | |
| BEC | The standard of statistical classification of BEC (Broad Economic Categories) is upheld by the UN and it is based on SITC-nomenclature. | ███ | ███ | ███ | |
| NACE | National industrial classification based on Statistical Classification of Economic Activities in the European Community Nomenclature générale des Activités économiques dans les Communautés européennes | ███ | ███ | ███ | |
| CPA | CPA = Classification of Products by Activities | ███ | ███ | ███ | |
| CN | The Combined Nomenclature is the common nomenclature of the European Community. | ███ | ███ | ███ |