
| Export of goods from Finland and import to Finland | BEC (Broad Economic Categories) |
*) The standard of statistical classification of BEC (Broad Economic Categories) is upheld by the UN and it is based on SITC-nomenclature.
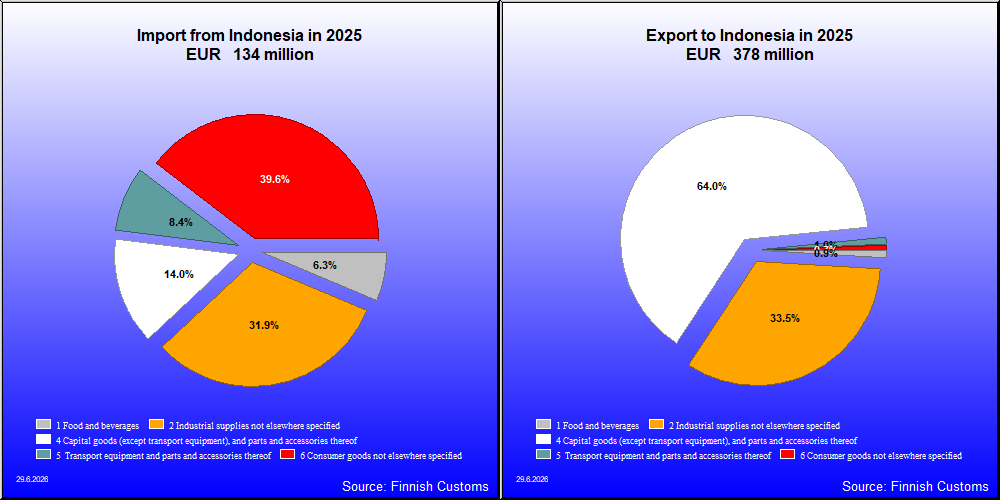
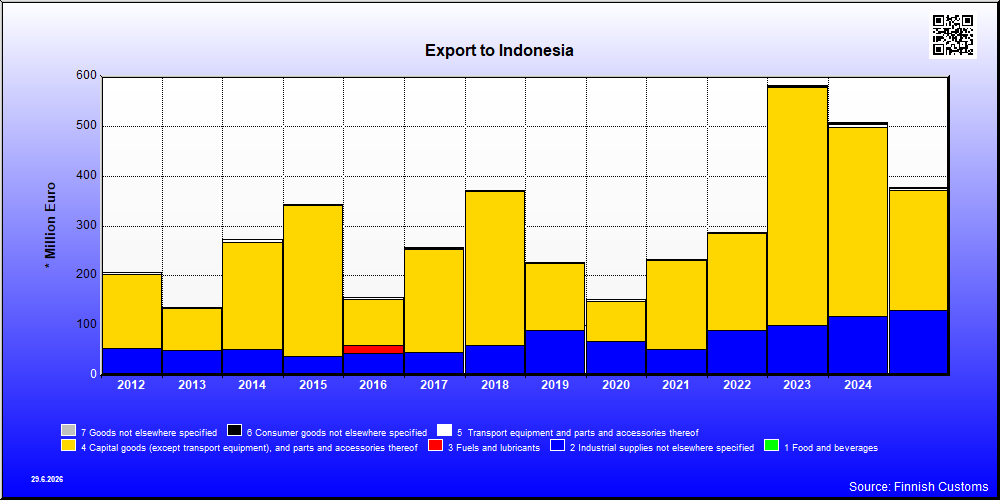
| 2021 | 2022 | 2023 | 2024 | 2025 | ||||||
|---|---|---|---|---|---|---|---|---|---|---|
| 1,000 € | % | 1,000 € | % | 1,000 € | % | 1,000 € | % | 1,000 € | % | |
| 1. Food and beverages | 1,845 | 0.8 | 3,316 | 1.2 | 2,791 | 0.5 | 3,136 | 0.6 | 3,255 | 0.9 |
| 11. Food and beverages, primary | 224 | 0.1 | 69 | 0.0 | ||||||
| 112. Food and beverages, primary, mainly for household consumption | 224 | 0.1 | 69 | 0.0 | ||||||
| 12. Food and beverages, processed | 1,845 | 0.8 | 3,092 | 1.1 | 2,722 | 0.5 | 3,136 | 0.6 | 3,255 | 0.9 |
| 121. Food and beverages, processed, mainly for industry | 384 | 0.2 | 1,027 | 0.4 | 599 | 0.1 | 1,176 | 0.2 | 1,043 | 0.3 |
| 122. Food and beverages, processed, mainly for household consumption | 1,460 | 0.6 | 2,065 | 0.7 | 2,123 | 0.4 | 1,960 | 0.4 | 2,212 | 0.6 |
| 2. Industrial supplies not elsewhere specified | 50,720 | 21.8 | 86,479 | 30.0 | 98,061 | 16.8 | 116,027 | 22.9 | 126,401 | 33.4 |
| 21. Industrial supplies not elsewhere specified, primary | 27 | 0.0 | 83 | 0.0 | 380 | 0.1 | 72 | 0.0 | 102 | 0.0 |
| 22. Industrial supplies not elsewhere specified, processed | 50,693 | 21.8 | 86,396 | 30.0 | 97,681 | 16.8 | 115,955 | 22.9 | 126,298 | 33.4 |
| 3. Fuels and lubricants | 3 | 0.0 | 7 | 0.0 | 11 | 0.0 | 22 | 0.0 | ||
| 32. Fuels and lubricants, processed | 3 | 0.0 | 7 | 0.0 | 11 | 0.0 | 22 | 0.0 | ||
| 322. Fuels and lubricants, other | 3 | 0.0 | 7 | 0.0 | 11 | 0.0 | 22 | 0.0 | ||
| 4. Capital goods (except transport equipment), and parts and accessories thereof | 177,546 | 76.4 | 194,949 | 67.7 | 476,340 | 81.8 | 378,201 | 74.6 | 241,775 | 64.0 |
| 41. Capital goods (except transport equipment) | 89,131 | 38.4 | 127,285 | 44.2 | 296,784 | 50.9 | 154,671 | 30.5 | 186,357 | 49.3 |
| 42. Capital goods (except transport equipment), parts and accessories | 88,416 | 38.1 | 67,664 | 23.5 | 179,556 | 30.8 | 223,530 | 44.1 | 55,418 | 14.7 |
| 5. Transport equipment and parts and accessories thereof | 709 | 0.3 | 1,178 | 0.4 | 3,169 | 0.5 | 6,420 | 1.3 | 3,673 | 1.0 |
| 51. Passenger motor vehicles | 309 | 0.1 | ||||||||
| 52. Transport equipment, other than passenger motor vehicles | 352 | 0.1 | 1,939 | 0.3 | 1,318 | 0.3 | 2,806 | 0.7 | ||
| 521. Transport equipment, other than passenger motor vehicles, industrial | 352 | 0.1 | 1,931 | 0.3 | 1,318 | 0.3 | 2,806 | 0.7 | ||
| 522. Transport equipment, other than passenger motor vehicles, non-industrial | 7 | 0.0 | ||||||||
| 53. Transport equipment, parts and accessories | 709 | 0.3 | 826 | 0.3 | 1,230 | 0.2 | 5,103 | 1.0 | 558 | 0.1 |
| 6. Consumer goods not elsewhere specified | 1,352 | 0.6 | 1,860 | 0.6 | 2,152 | 0.4 | 3,238 | 0.6 | 2,715 | 0.7 |
| 61. Consumer goods not elsewhere specified, durable | 48 | 0.0 | 68 | 0.0 | 102 | 0.0 | 83 | 0.0 | 112 | 0.0 |
| 62. Consumer goods not elsewhere specified, semi-durable | 360 | 0.2 | 406 | 0.1 | 626 | 0.1 | 1,248 | 0.2 | 719 | 0.2 |
| 63. Consumer goods not elsewhere specified, non-durable | 944 | 0.4 | 1,386 | 0.5 | 1,425 | 0.2 | 1,907 | 0.4 | 1,884 | 0.5 |
| 7. Goods not elsewhere specified | 82 | 0.0 | 41 | 0.0 | 237 | 0.0 | 91 | 0.0 | ||
| All groups | 232,256 | 100.0 | 287,823 | 100.0 | 582,520 | 100.0 | 507,270 | 100.0 | 377,931 | 100.0 |
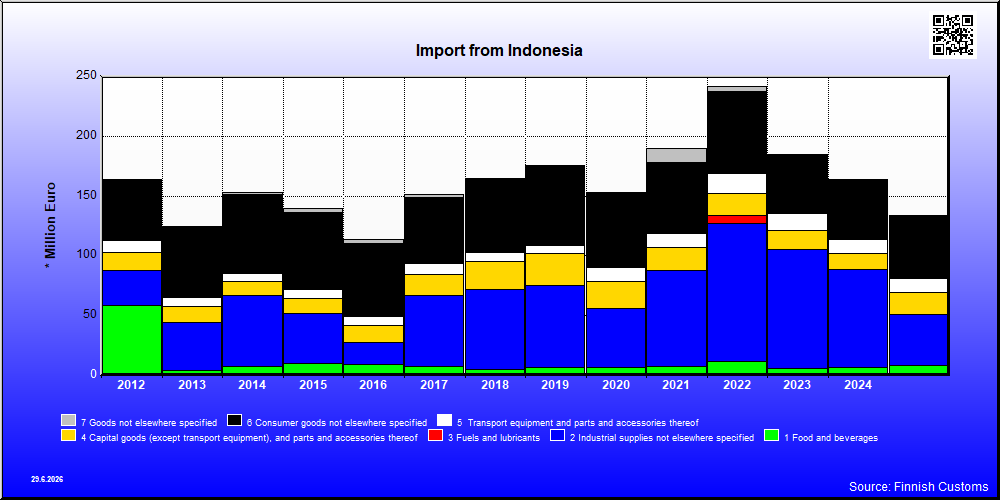
| 2021 | 2022 | 2023 | 2024 | 2025 | ||||||
|---|---|---|---|---|---|---|---|---|---|---|
| 1,000 € | % | 1,000 € | % | 1,000 € | % | 1,000 € | % | 1,000 € | % | |
| 1. Food and beverages | 7,339 | 3.9 | 11,839 | 4.9 | 6,061 | 3.3 | 6,793 | 4.2 | 8,387 | 6.3 |
| 11. Food and beverages, primary | 1,435 | 0.8 | 1,739 | 0.7 | 1,412 | 0.8 | 1,119 | 0.7 | 957 | 0.7 |
| 111. Food and beverages, primary, mainly for industry | 236 | 0.1 | 155 | 0.1 | 174 | 0.1 | 81 | 0.0 | 121 | 0.1 |
| 112. Food and beverages, primary, mainly for household consumption | 1,199 | 0.6 | 1,584 | 0.7 | 1,237 | 0.7 | 1,037 | 0.6 | 835 | 0.6 |
| 12. Food and beverages, processed | 5,904 | 3.1 | 10,100 | 4.2 | 4,650 | 2.5 | 5,674 | 3.5 | 7,431 | 5.6 |
| 121. Food and beverages, processed, mainly for industry | 139 | 0.1 | 122 | 0.1 | 85 | 0.0 | 101 | 0.1 | 65 | 0.0 |
| 122. Food and beverages, processed, mainly for household consumption | 5,765 | 3.0 | 9,978 | 4.1 | 4,565 | 2.5 | 5,574 | 3.4 | 7,366 | 5.5 |
| 2. Industrial supplies not elsewhere specified | 80,236 | 42.2 | 115,619 | 47.8 | 99,034 | 53.5 | 81,550 | 49.8 | 42,536 | 31.8 |
| 21. Industrial supplies not elsewhere specified, primary | 7,436 | 3.9 | 19,966 | 8.3 | 8,477 | 4.6 | 23,283 | 14.2 | 19,760 | 14.8 |
| 22. Industrial supplies not elsewhere specified, processed | 72,800 | 38.3 | 95,653 | 39.6 | 90,557 | 48.9 | 58,267 | 35.6 | 22,775 | 17.0 |
| 3. Fuels and lubricants | 41 | 0.0 | 6,340 | 2.6 | 116 | 0.1 | 145 | 0.1 | 126 | 0.1 |
| 31. Fuels and lubricants, primary | 6,227 | 2.6 | ||||||||
| 32. Fuels and lubricants, processed | 41 | 0.0 | 113 | 0.0 | 116 | 0.1 | 145 | 0.1 | 126 | 0.1 |
| 321. Fuels and lubricants, motor spirit | 5 | 0.0 | ||||||||
| 322. Fuels and lubricants, other | 37 | 0.0 | 113 | 0.0 | 116 | 0.1 | 145 | 0.1 | 126 | 0.1 |
| 4. Capital goods (except transport equipment), and parts and accessories thereof | 19,374 | 10.2 | 18,513 | 7.7 | 16,266 | 8.8 | 13,225 | 8.1 | 18,642 | 13.9 |
| 41. Capital goods (except transport equipment) | 15,136 | 8.0 | 11,318 | 4.7 | 9,305 | 5.0 | 8,691 | 5.3 | 14,277 | 10.7 |
| 42. Capital goods (except transport equipment), parts and accessories | 4,238 | 2.2 | 7,195 | 3.0 | 6,961 | 3.8 | 4,535 | 2.8 | 4,365 | 3.3 |
| 5. Transport equipment and parts and accessories thereof | 11,558 | 6.1 | 16,765 | 6.9 | 13,819 | 7.5 | 12,268 | 7.5 | 11,160 | 8.3 |
| 51. Passenger motor vehicles | 10 | 0.0 | ||||||||
| 52. Transport equipment, other than passenger motor vehicles | 4,837 | 2.5 | 6,681 | 2.8 | 4,427 | 2.4 | 2,824 | 1.7 | 2,540 | 1.9 |
| 521. Transport equipment, other than passenger motor vehicles, industrial | 714 | 0.4 | ||||||||
| 522. Transport equipment, other than passenger motor vehicles, non-industrial | 4,837 | 2.5 | 6,681 | 2.8 | 3,713 | 2.0 | 2,824 | 1.7 | 2,540 | 1.9 |
| 53. Transport equipment, parts and accessories | 6,712 | 3.5 | 10,084 | 4.2 | 9,392 | 5.1 | 9,444 | 5.8 | 8,620 | 6.4 |
| 6. Consumer goods not elsewhere specified | 59,173 | 31.1 | 68,732 | 28.4 | 49,664 | 26.8 | 49,588 | 30.3 | 52,816 | 39.5 |
| 61. Consumer goods not elsewhere specified, durable | 10,090 | 5.3 | 12,014 | 5.0 | 9,342 | 5.0 | 7,890 | 4.8 | 6,710 | 5.0 |
| 62. Consumer goods not elsewhere specified, semi-durable | 38,259 | 20.1 | 49,870 | 20.6 | 35,996 | 19.5 | 37,161 | 22.7 | 41,461 | 31.0 |
| 63. Consumer goods not elsewhere specified, non-durable | 10,823 | 5.7 | 6,848 | 2.8 | 4,326 | 2.3 | 4,537 | 2.8 | 4,644 | 3.5 |
| 7. Goods not elsewhere specified | 12,382 | 6.5 | 3,851 | 1.6 | 70 | 0.0 | 82 | 0.1 | 88 | 0.1 |
| All groups | 190,103 | 100.0 | 241,660 | 100.0 | 185,031 | 100.0 | 163,652 | 100.0 | 133,755 | 100.0 |
| Classification | Description | Year level | Quarter level | Month level | |
|---|---|---|---|---|---|
| SITC | Standard International Trade Classification (classification system is maintained by the United Nations) | ███ | ███ | ███ | |
| BEC | The standard of statistical classification of BEC (Broad Economic Categories) is upheld by the UN and it is based on SITC-nomenclature. | ███ | ███ | ███ | |
| NACE | National industrial classification based on Statistical Classification of Economic Activities in the European Community Nomenclature générale des Activités économiques dans les Communautés européennes | ███ | ███ | ███ | |
| CPA | CPA = Classification of Products by Activities | ███ | ███ | ███ | |
| CN | The Combined Nomenclature is the common nomenclature of the European Community. | ███ | ███ | ███ |