
| Export of goods from Finland and import to Finland | BEC (Broad Economic Categories) |
*) The standard of statistical classification of BEC (Broad Economic Categories) is upheld by the UN and it is based on SITC-nomenclature.
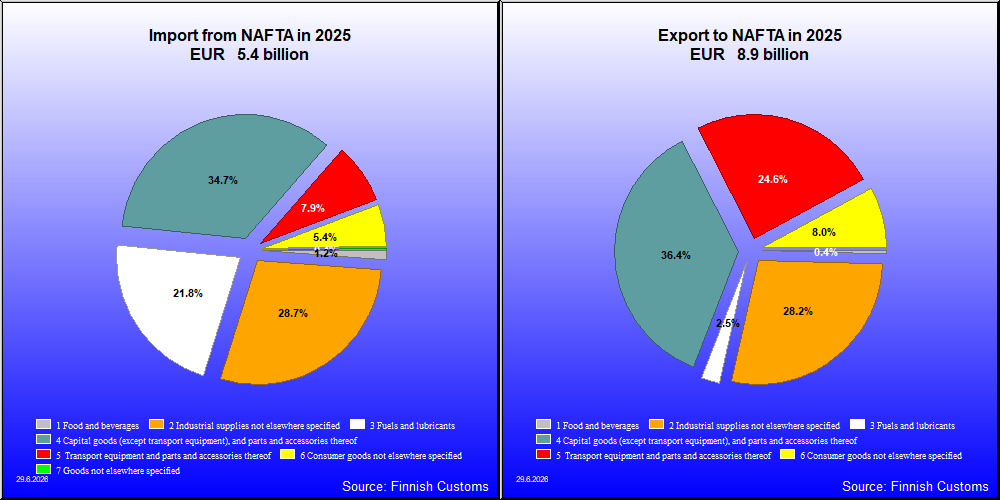

| 2021 | 2022 | 2023 | 2024 | 2025 | ||||||
|---|---|---|---|---|---|---|---|---|---|---|
| 1,000 € | % | 1,000 € | % | 1,000 € | % | 1,000 € | % | 1,000 € | % | |
| 1. Food and beverages | 34,701 | 0.6 | 41,124 | 0.4 | 30,441 | 0.3 | 34,452 | 0.4 | 36,794 | 0.4 |
| 11. Food and beverages, primary | 1,953 | 0.0 | 2,349 | 0.0 | 1,685 | 0.0 | 2,414 | 0.0 | 2,840 | 0.0 |
| 111. Food and beverages, primary, mainly for industry | 22 | 0.0 | 37 | 0.0 | 37 | 0.0 | 23 | 0.0 | 27 | 0.0 |
| 112. Food and beverages, primary, mainly for household consumption | 1,931 | 0.0 | 2,311 | 0.0 | 1,648 | 0.0 | 2,391 | 0.0 | 2,813 | 0.0 |
| 12. Food and beverages, processed | 32,748 | 0.6 | 38,775 | 0.4 | 28,756 | 0.3 | 32,038 | 0.4 | 33,954 | 0.4 |
| 121. Food and beverages, processed, mainly for industry | 3,417 | 0.1 | 2,666 | 0.0 | 785 | 0.0 | 791 | 0.0 | 3,051 | 0.0 |
| 122. Food and beverages, processed, mainly for household consumption | 29,330 | 0.5 | 36,109 | 0.4 | 27,971 | 0.3 | 31,247 | 0.4 | 30,903 | 0.3 |
| 2. Industrial supplies not elsewhere specified | 2,030,622 | 35.0 | 2,874,164 | 30.4 | 2,500,375 | 24.9 | 2,648,155 | 31.8 | 2,510,912 | 28.1 |
| 21. Industrial supplies not elsewhere specified, primary | 52,270 | 0.9 | 74,934 | 0.8 | 158,879 | 1.6 | 97,661 | 1.2 | 80,358 | 0.9 |
| 22. Industrial supplies not elsewhere specified, processed | 1,978,353 | 34.1 | 2,799,230 | 29.6 | 2,341,496 | 23.3 | 2,550,493 | 30.7 | 2,430,555 | 27.2 |
| 3. Fuels and lubricants | 579,727 | 10.0 | 1,250,048 | 13.2 | 1,124,774 | 11.2 | 718,081 | 8.6 | 218,589 | 2.4 |
| 31. Fuels and lubricants, primary | 1,414 | 0.0 | 3,864 | 0.0 | 2,644 | 0.0 | 1,886 | 0.0 | 3,592 | 0.0 |
| 32. Fuels and lubricants, processed | 578,313 | 10.0 | 1,246,184 | 13.2 | 1,122,129 | 11.2 | 716,195 | 8.6 | 214,996 | 2.4 |
| 321. Fuels and lubricants, motor spirit | 578,209 | 10.0 | 1,220,087 | 12.9 | 1,105,631 | 11.0 | 633,389 | 7.6 | 213,962 | 2.4 |
| 322. Fuels and lubricants, other | 104 | 0.0 | 26,097 | 0.3 | 16,498 | 0.2 | 82,806 | 1.0 | 1,034 | 0.0 |
| 4. Capital goods (except transport equipment), and parts and accessories thereof | 2,514,295 | 43.3 | 3,394,294 | 35.9 | 3,209,350 | 32.0 | 3,409,858 | 41.0 | 3,241,950 | 36.3 |
| 41. Capital goods (except transport equipment) | 1,937,589 | 33.4 | 2,648,227 | 28.0 | 2,533,937 | 25.2 | 2,627,243 | 31.6 | 2,472,685 | 27.7 |
| 42. Capital goods (except transport equipment), parts and accessories | 576,707 | 9.9 | 746,067 | 7.9 | 675,413 | 6.7 | 782,616 | 9.4 | 769,265 | 8.6 |
| 5. Transport equipment and parts and accessories thereof | 259,645 | 4.5 | 1,417,859 | 15.0 | 2,378,215 | 23.7 | 403,448 | 4.9 | 2,190,247 | 24.5 |
| 51. Passenger motor vehicles | 652 | 0.0 | 270 | 0.0 | 655 | 0.0 | 255 | 0.0 | 639 | 0.0 |
| 52. Transport equipment, other than passenger motor vehicles | 146,160 | 2.5 | 1,219,777 | 12.9 | 2,118,188 | 21.1 | 195,046 | 2.3 | 2,015,559 | 22.6 |
| 521. Transport equipment, other than passenger motor vehicles, industrial | 115,032 | 2.0 | 1,119,980 | 11.8 | 2,047,506 | 20.4 | 134,562 | 1.6 | 1,960,372 | 22.0 |
| 522. Transport equipment, other than passenger motor vehicles, non-industrial | 31,129 | 0.5 | 99,797 | 1.1 | 70,682 | 0.7 | 60,484 | 0.7 | 55,187 | 0.6 |
| 53. Transport equipment, parts and accessories | 112,833 | 1.9 | 197,812 | 2.1 | 259,372 | 2.6 | 208,147 | 2.5 | 174,049 | 2.0 |
| 6. Consumer goods not elsewhere specified | 371,234 | 6.4 | 475,649 | 5.0 | 777,449 | 7.7 | 1,091,410 | 13.1 | 714,567 | 8.0 |
| 61. Consumer goods not elsewhere specified, durable | 59,813 | 1.0 | 64,904 | 0.7 | 79,404 | 0.8 | 76,243 | 0.9 | 83,810 | 0.9 |
| 62. Consumer goods not elsewhere specified, semi-durable | 42,564 | 0.7 | 69,277 | 0.7 | 66,391 | 0.7 | 65,035 | 0.8 | 71,670 | 0.8 |
| 63. Consumer goods not elsewhere specified, non-durable | 268,857 | 4.6 | 341,468 | 3.6 | 631,654 | 6.3 | 950,132 | 11.4 | 559,087 | 6.3 |
| 7. Goods not elsewhere specified | 11,756 | 0.2 | 13,479 | 0.1 | 22,898 | 0.2 | 11,798 | 0.1 | 11,027 | 0.1 |
| All groups | 5,801,980 | 100.0 | 9,466,618 | 100.0 | 10,043,501 | 100.0 | 8,317,202 | 100.0 | 8,924,086 | 100.0 |

| 2021 | 2022 | 2023 | 2024 | 2025 | ||||||
|---|---|---|---|---|---|---|---|---|---|---|
| 1,000 € | % | 1,000 € | % | 1,000 € | % | 1,000 € | % | 1,000 € | % | |
| 1. Food and beverages | 69,092 | 2.2 | 86,925 | 1.7 | 76,679 | 1.6 | 70,867 | 1.5 | 62,837 | 1.2 |
| 11. Food and beverages, primary | 27,631 | 0.9 | 35,266 | 0.7 | 24,345 | 0.5 | 24,305 | 0.5 | 21,798 | 0.4 |
| 111. Food and beverages, primary, mainly for industry | 11,401 | 0.4 | 17,635 | 0.3 | 12,646 | 0.3 | 8,604 | 0.2 | 8,915 | 0.2 |
| 112. Food and beverages, primary, mainly for household consumption | 16,230 | 0.5 | 17,630 | 0.3 | 11,699 | 0.2 | 15,700 | 0.3 | 12,882 | 0.2 |
| 12. Food and beverages, processed | 41,461 | 1.3 | 51,659 | 1.0 | 52,335 | 1.1 | 46,562 | 1.0 | 41,040 | 0.8 |
| 121. Food and beverages, processed, mainly for industry | 943 | 0.0 | 686 | 0.0 | 1,018 | 0.0 | 647 | 0.0 | 791 | 0.0 |
| 122. Food and beverages, processed, mainly for household consumption | 40,518 | 1.3 | 50,973 | 1.0 | 51,317 | 1.0 | 45,915 | 1.0 | 40,249 | 0.7 |
| 2. Industrial supplies not elsewhere specified | 1,195,773 | 37.7 | 1,746,083 | 33.2 | 1,293,460 | 26.3 | 1,548,329 | 32.7 | 1,540,196 | 28.7 |
| 21. Industrial supplies not elsewhere specified, primary | 355,348 | 11.2 | 563,847 | 10.7 | 266,240 | 5.4 | 456,870 | 9.6 | 351,759 | 6.6 |
| 22. Industrial supplies not elsewhere specified, processed | 840,425 | 26.5 | 1,182,236 | 22.5 | 1,027,221 | 20.9 | 1,091,459 | 23.0 | 1,188,437 | 22.1 |
| 3. Fuels and lubricants | 215,260 | 6.8 | 1,272,852 | 24.2 | 1,498,781 | 30.5 | 1,171,959 | 24.7 | 1,170,636 | 21.8 |
| 31. Fuels and lubricants, primary | 177,816 | 5.6 | 988,630 | 18.8 | 961,584 | 19.6 | 628,628 | 13.3 | 689,918 | 12.9 |
| 32. Fuels and lubricants, processed | 37,444 | 1.2 | 284,222 | 5.4 | 537,197 | 10.9 | 543,331 | 11.5 | 480,718 | 9.0 |
| 321. Fuels and lubricants, motor spirit | 10,192 | 0.3 | 36 | 0.0 | 43 | 0.0 | 27,084 | 0.6 | 22 | 0.0 |
| 322. Fuels and lubricants, other | 27,252 | 0.9 | 284,186 | 5.4 | 537,153 | 10.9 | 516,247 | 10.9 | 480,696 | 9.0 |
| 4. Capital goods (except transport equipment), and parts and accessories thereof | 795,859 | 25.1 | 1,255,209 | 23.9 | 1,169,609 | 23.8 | 1,149,073 | 24.2 | 1,860,504 | 34.7 |
| 41. Capital goods (except transport equipment) | 556,745 | 17.5 | 963,866 | 18.3 | 918,949 | 18.7 | 905,254 | 19.1 | 1,594,643 | 29.7 |
| 42. Capital goods (except transport equipment), parts and accessories | 239,114 | 7.5 | 291,343 | 5.5 | 250,659 | 5.1 | 243,819 | 5.1 | 265,860 | 5.0 |
| 5. Transport equipment and parts and accessories thereof | 591,889 | 18.6 | 544,891 | 10.4 | 513,393 | 10.5 | 439,576 | 9.3 | 421,999 | 7.9 |
| 51. Passenger motor vehicles | 220,813 | 7.0 | 160,432 | 3.0 | 147,088 | 3.0 | 96,821 | 2.0 | 85,187 | 1.6 |
| 52. Transport equipment, other than passenger motor vehicles | 136,064 | 4.3 | 91,371 | 1.7 | 89,606 | 1.8 | 45,576 | 1.0 | 61,835 | 1.2 |
| 521. Transport equipment, other than passenger motor vehicles, industrial | 68,536 | 2.2 | 19,340 | 0.4 | 43,769 | 0.9 | 16,444 | 0.3 | 37,163 | 0.7 |
| 522. Transport equipment, other than passenger motor vehicles, non-industrial | 67,528 | 2.1 | 72,031 | 1.4 | 45,838 | 0.9 | 29,133 | 0.6 | 24,672 | 0.5 |
| 53. Transport equipment, parts and accessories | 235,012 | 7.4 | 293,088 | 5.6 | 276,699 | 5.6 | 297,180 | 6.3 | 274,976 | 5.1 |
| 6. Consumer goods not elsewhere specified | 273,555 | 8.6 | 316,493 | 6.0 | 334,562 | 6.8 | 332,665 | 7.0 | 289,151 | 5.4 |
| 61. Consumer goods not elsewhere specified, durable | 80,168 | 2.5 | 97,003 | 1.8 | 104,221 | 2.1 | 92,074 | 1.9 | 88,327 | 1.6 |
| 62. Consumer goods not elsewhere specified, semi-durable | 62,672 | 2.0 | 60,846 | 1.2 | 53,236 | 1.1 | 75,126 | 1.6 | 55,781 | 1.0 |
| 63. Consumer goods not elsewhere specified, non-durable | 130,714 | 4.1 | 158,643 | 3.0 | 177,104 | 3.6 | 165,466 | 3.5 | 145,042 | 2.7 |
| 7. Goods not elsewhere specified | 33,170 | 1.0 | 38,196 | 0.7 | 24,347 | 0.5 | 26,552 | 0.6 | 23,666 | 0.4 |
| All groups | 3,174,597 | 100.0 | 5,260,649 | 100.0 | 4,910,831 | 100.0 | 4,739,022 | 100.0 | 5,368,988 | 100.0 |
| Classification | Description | Year level | Quarter level | Month level | |
|---|---|---|---|---|---|
| SITC | Standard International Trade Classification (classification system is maintained by the United Nations) | ███ | ███ | ███ | |
| BEC | The standard of statistical classification of BEC (Broad Economic Categories) is upheld by the UN and it is based on SITC-nomenclature. | ███ | ███ | ███ | |
| NACE | National industrial classification based on Statistical Classification of Economic Activities in the European Community Nomenclature générale des Activités économiques dans les Communautés européennes | ███ | ███ | ███ | |
| CPA | CPA = Classification of Products by Activities | ███ | ███ | ███ | |
| CN | The Combined Nomenclature is the common nomenclature of the European Community. | ███ | ███ | ███ |