
| Export of goods from Finland and import to Finland | BEC (Broad Economic Categories) |
*) The standard of statistical classification of BEC (Broad Economic Categories) is upheld by the UN and it is based on SITC-nomenclature.
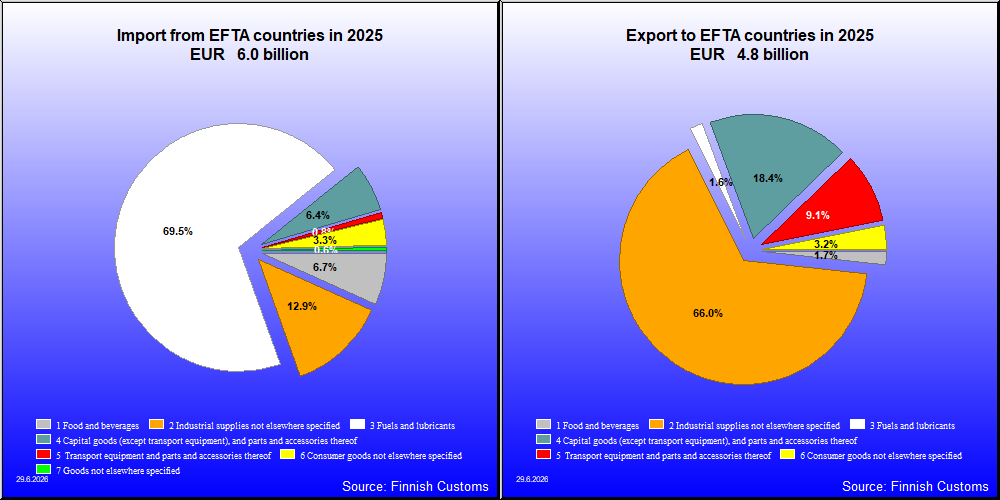
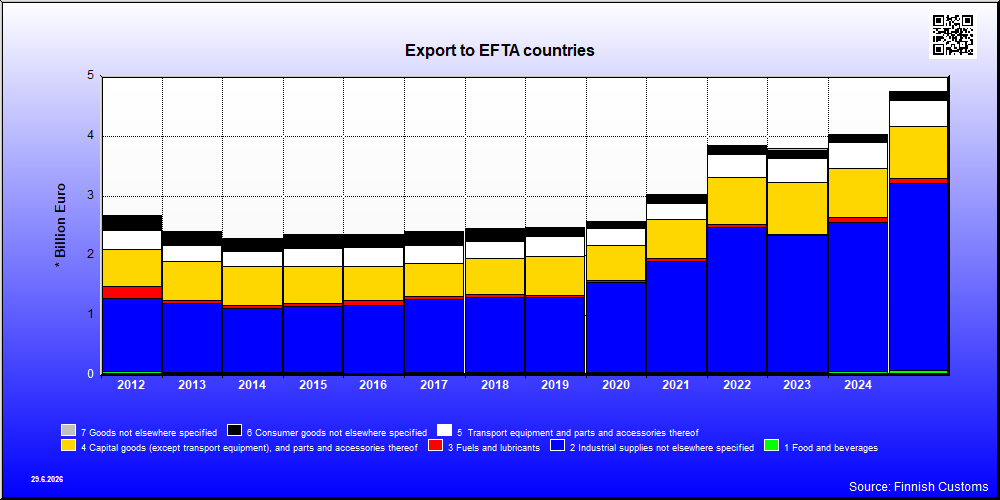
| 2021 | 2022 | 2023 | 2024 | 2025 | ||||||
|---|---|---|---|---|---|---|---|---|---|---|
| 1,000 € | % | 1,000 € | % | 1,000 € | % | 1,000 € | % | 1,000 € | % | |
| 1. Food and beverages | 52,943 | 1.8 | 52,330 | 1.4 | 55,421 | 1.5 | 72,058 | 1.8 | 79,072 | 1.7 |
| 11. Food and beverages, primary | 3,945 | 0.1 | 1,877 | 0.0 | 3,348 | 0.1 | 13,575 | 0.3 | 8,314 | 0.2 |
| 111. Food and beverages, primary, mainly for industry | 1,800 | 0.1 | 267 | 0.0 | 707 | 0.0 | 6,240 | 0.2 | 2,008 | 0.0 |
| 112. Food and beverages, primary, mainly for household consumption | 2,145 | 0.1 | 1,610 | 0.0 | 2,642 | 0.1 | 7,334 | 0.2 | 6,306 | 0.1 |
| 12. Food and beverages, processed | 48,999 | 1.6 | 50,453 | 1.3 | 52,073 | 1.4 | 58,483 | 1.4 | 70,758 | 1.5 |
| 121. Food and beverages, processed, mainly for industry | 8,836 | 0.3 | 5,391 | 0.1 | 5,042 | 0.1 | 5,495 | 0.1 | 14,636 | 0.3 |
| 122. Food and beverages, processed, mainly for household consumption | 40,162 | 1.3 | 45,062 | 1.2 | 47,031 | 1.2 | 52,988 | 1.3 | 56,122 | 1.2 |
| 2. Industrial supplies not elsewhere specified | 1,855,819 | 61.5 | 2,429,319 | 63.1 | 2,287,785 | 60.3 | 2,486,188 | 61.6 | 3,135,004 | 65.9 |
| 21. Industrial supplies not elsewhere specified, primary | 197,213 | 6.5 | 231,354 | 6.0 | 136,941 | 3.6 | 152,718 | 3.8 | 855,097 | 18.0 |
| 22. Industrial supplies not elsewhere specified, processed | 1,658,606 | 54.9 | 2,197,965 | 57.1 | 2,150,845 | 56.7 | 2,333,470 | 57.8 | 2,279,907 | 47.9 |
| 3. Fuels and lubricants | 44,779 | 1.5 | 50,426 | 1.3 | 16,126 | 0.4 | 80,260 | 2.0 | 78,011 | 1.6 |
| 31. Fuels and lubricants, primary | 771 | 0.0 | 1,313 | 0.0 | 604 | 0.0 | 409 | 0.0 | 371 | 0.0 |
| 32. Fuels and lubricants, processed | 44,009 | 1.5 | 49,113 | 1.3 | 15,522 | 0.4 | 79,850 | 2.0 | 77,640 | 1.6 |
| 321. Fuels and lubricants, motor spirit | 30,007 | 1.0 | 20,875 | 0.5 | 9,109 | 0.2 | 7,869 | 0.2 | 14,681 | 0.3 |
| 322. Fuels and lubricants, other | 14,002 | 0.5 | 28,238 | 0.7 | 6,413 | 0.2 | 79,826 | 2.0 | 62,959 | 1.3 |
| 4. Capital goods (except transport equipment), and parts and accessories thereof | 653,049 | 21.6 | 779,025 | 20.2 | 863,110 | 22.8 | 825,577 | 20.4 | 872,681 | 18.3 |
| 41. Capital goods (except transport equipment) | 524,297 | 17.4 | 632,385 | 16.4 | 676,381 | 17.8 | 627,869 | 15.6 | 669,292 | 14.1 |
| 42. Capital goods (except transport equipment), parts and accessories | 128,752 | 4.3 | 146,640 | 3.8 | 186,728 | 4.9 | 197,708 | 4.9 | 203,389 | 4.3 |
| 5. Transport equipment and parts and accessories thereof | 275,201 | 9.1 | 390,580 | 10.1 | 409,911 | 10.8 | 439,784 | 10.9 | 432,922 | 9.1 |
| 51. Passenger motor vehicles | 1,700 | 0.1 | 5,538 | 0.1 | 5,988 | 0.2 | 5,755 | 0.1 | 7,126 | 0.1 |
| 52. Transport equipment, other than passenger motor vehicles | 184,837 | 6.1 | 256,491 | 6.7 | 275,145 | 7.3 | 280,703 | 7.0 | 268,770 | 5.7 |
| 521. Transport equipment, other than passenger motor vehicles, industrial | 100,541 | 3.3 | 126,366 | 3.3 | 181,799 | 4.8 | 200,399 | 5.0 | 211,960 | 4.5 |
| 522. Transport equipment, other than passenger motor vehicles, non-industrial | 84,296 | 2.8 | 130,125 | 3.4 | 93,347 | 2.5 | 80,304 | 2.0 | 56,837 | 1.2 |
| 53. Transport equipment, parts and accessories | 88,665 | 2.9 | 128,551 | 3.3 | 128,778 | 3.4 | 153,326 | 3.8 | 157,027 | 3.3 |
| 6. Consumer goods not elsewhere specified | 132,461 | 4.4 | 138,273 | 3.6 | 136,687 | 3.6 | 122,555 | 3.0 | 152,068 | 3.2 |
| 61. Consumer goods not elsewhere specified, durable | 19,734 | 0.7 | 19,075 | 0.5 | 21,373 | 0.6 | 17,677 | 0.4 | 23,390 | 0.5 |
| 62. Consumer goods not elsewhere specified, semi-durable | 68,288 | 2.3 | 72,486 | 1.9 | 62,441 | 1.6 | 64,253 | 1.6 | 82,505 | 1.7 |
| 63. Consumer goods not elsewhere specified, non-durable | 44,439 | 1.5 | 46,712 | 1.2 | 52,872 | 1.4 | 40,625 | 1.0 | 46,173 | 1.0 |
| 7. Goods not elsewhere specified | 5,347 | 0.2 | 8,953 | 0.2 | 24,839 | 0.7 | 10,998 | 0.3 | 6,518 | 0.1 |
| All groups | 3,019,600 | 100.0 | 3,848,906 | 100.0 | 3,793,879 | 100.0 | 4,037,420 | 100.0 | 4,756,276 | 100.0 |
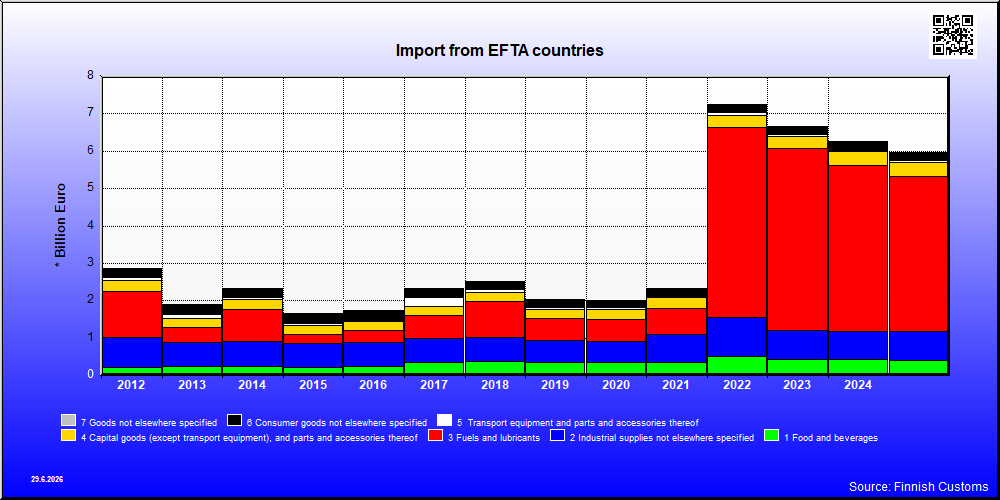
| 2021 | 2022 | 2023 | 2024 | 2025 | ||||||
|---|---|---|---|---|---|---|---|---|---|---|
| 1,000 € | % | 1,000 € | % | 1,000 € | % | 1,000 € | % | 1,000 € | % | |
| 1. Food and beverages | 356,624 | 15.3 | 512,550 | 7.1 | 420,811 | 6.3 | 421,232 | 6.7 | 400,316 | 6.7 |
| 11. Food and beverages, primary | 255,722 | 11.0 | 376,046 | 5.2 | 295,964 | 4.4 | 311,434 | 5.0 | 296,313 | 5.0 |
| 111. Food and beverages, primary, mainly for industry | 405 | 0.0 | 317 | 0.0 | 127 | 0.0 | 206 | 0.0 | 299 | 0.0 |
| 112. Food and beverages, primary, mainly for household consumption | 255,317 | 11.0 | 375,730 | 5.2 | 295,837 | 4.4 | 311,228 | 5.0 | 296,013 | 5.0 |
| 12. Food and beverages, processed | 100,902 | 4.3 | 136,503 | 1.9 | 124,847 | 1.9 | 109,798 | 1.8 | 104,004 | 1.7 |
| 121. Food and beverages, processed, mainly for industry | 7,007 | 0.3 | 5,954 | 0.1 | 6,010 | 0.1 | 5,629 | 0.1 | 10,325 | 0.2 |
| 122. Food and beverages, processed, mainly for household consumption | 93,895 | 4.0 | 130,550 | 1.8 | 118,838 | 1.8 | 104,169 | 1.7 | 93,679 | 1.6 |
| 2. Industrial supplies not elsewhere specified | 727,652 | 31.2 | 1,049,211 | 14.4 | 789,868 | 11.9 | 750,554 | 12.0 | 767,689 | 12.9 |
| 21. Industrial supplies not elsewhere specified, primary | 51,474 | 2.2 | 57,559 | 0.8 | 53,017 | 0.8 | 60,913 | 1.0 | 65,147 | 1.1 |
| 22. Industrial supplies not elsewhere specified, processed | 676,178 | 29.0 | 991,652 | 13.7 | 736,850 | 11.1 | 689,641 | 11.0 | 702,542 | 11.8 |
| 3. Fuels and lubricants | 721,437 | 31.0 | 5,070,390 | 69.8 | 4,868,425 | 73.1 | 4,456,327 | 71.3 | 4,146,365 | 69.5 |
| 31. Fuels and lubricants, primary | 660,906 | 28.4 | 4,919,839 | 67.7 | 4,654,071 | 69.9 | 3,866,861 | 61.9 | 3,914,289 | 65.6 |
| 32. Fuels and lubricants, processed | 60,531 | 2.6 | 155,469 | 2.1 | 214,354 | 3.2 | 589,466 | 9.4 | 232,076 | 3.9 |
| 321. Fuels and lubricants, motor spirit | 1,971 | 0.1 | 3,414 | 0.0 | 44 | 0.0 | 232 | 0.0 | 12 | 0.0 |
| 322. Fuels and lubricants, other | 58,561 | 2.5 | 152,054 | 2.1 | 214,310 | 3.2 | 589,306 | 9.4 | 232,064 | 3.9 |
| 4. Capital goods (except transport equipment), and parts and accessories thereof | 275,194 | 11.8 | 326,982 | 4.5 | 315,556 | 4.7 | 352,568 | 5.6 | 379,280 | 6.4 |
| 41. Capital goods (except transport equipment) | 180,411 | 7.7 | 216,809 | 3.0 | 210,122 | 3.2 | 246,882 | 4.0 | 259,802 | 4.4 |
| 42. Capital goods (except transport equipment), parts and accessories | 94,783 | 4.1 | 110,173 | 1.5 | 105,435 | 1.6 | 105,685 | 1.7 | 119,479 | 2.0 |
| 5. Transport equipment and parts and accessories thereof | 43,901 | 1.9 | 84,234 | 1.2 | 55,958 | 0.8 | 45,192 | 0.7 | 46,262 | 0.8 |
| 51. Passenger motor vehicles | 5,355 | 0.2 | 35,067 | 0.5 | 18,610 | 0.3 | 5,425 | 0.1 | 997 | 0.0 |
| 52. Transport equipment, other than passenger motor vehicles | 18,719 | 0.8 | 27,429 | 0.4 | 21,294 | 0.3 | 19,627 | 0.3 | 26,669 | 0.4 |
| 521. Transport equipment, other than passenger motor vehicles, industrial | 15,391 | 0.7 | 23,042 | 0.3 | 17,832 | 0.3 | 18,613 | 0.3 | 26,001 | 0.4 |
| 522. Transport equipment, other than passenger motor vehicles, non-industrial | 3,328 | 0.1 | 4,387 | 0.1 | 3,462 | 0.1 | 1,013 | 0.0 | 668 | 0.0 |
| 53. Transport equipment, parts and accessories | 19,827 | 0.9 | 21,737 | 0.3 | 16,054 | 0.2 | 20,140 | 0.3 | 18,595 | 0.3 |
| 6. Consumer goods not elsewhere specified | 189,771 | 8.1 | 198,898 | 2.7 | 189,491 | 2.8 | 195,313 | 3.1 | 194,275 | 3.3 |
| 61. Consumer goods not elsewhere specified, durable | 36,327 | 1.6 | 47,995 | 0.7 | 46,074 | 0.7 | 44,905 | 0.7 | 44,956 | 0.8 |
| 62. Consumer goods not elsewhere specified, semi-durable | 29,293 | 1.3 | 29,065 | 0.4 | 24,806 | 0.4 | 23,262 | 0.4 | 33,836 | 0.6 |
| 63. Consumer goods not elsewhere specified, non-durable | 124,151 | 5.3 | 121,838 | 1.7 | 118,611 | 1.8 | 127,146 | 2.0 | 115,483 | 1.9 |
| 7. Goods not elsewhere specified | 15,624 | 0.7 | 19,659 | 0.3 | 15,778 | 0.2 | 27,445 | 0.4 | 33,084 | 0.6 |
| All groups | 2,330,201 | 100.0 | 7,261,923 | 100.0 | 6,655,886 | 100.0 | 6,248,631 | 100.0 | 5,967,272 | 100.0 |
| Classification | Description | Year level | Quarter level | Month level | |
|---|---|---|---|---|---|
| SITC | Standard International Trade Classification (classification system is maintained by the United Nations) | ███ | ███ | ███ | |
| BEC | The standard of statistical classification of BEC (Broad Economic Categories) is upheld by the UN and it is based on SITC-nomenclature. | ███ | ███ | ███ | |
| NACE | National industrial classification based on Statistical Classification of Economic Activities in the European Community Nomenclature générale des Activités économiques dans les Communautés européennes | ███ | ███ | ███ | |
| CPA | CPA = Classification of Products by Activities | ███ | ███ | ███ | |
| CN | The Combined Nomenclature is the common nomenclature of the European Community. | ███ | ███ | ███ |