
| Export of goods from Finland and import to Finland | BEC (Broad Economic Categories) |
*) The standard of statistical classification of BEC (Broad Economic Categories) is upheld by the UN and it is based on SITC-nomenclature.
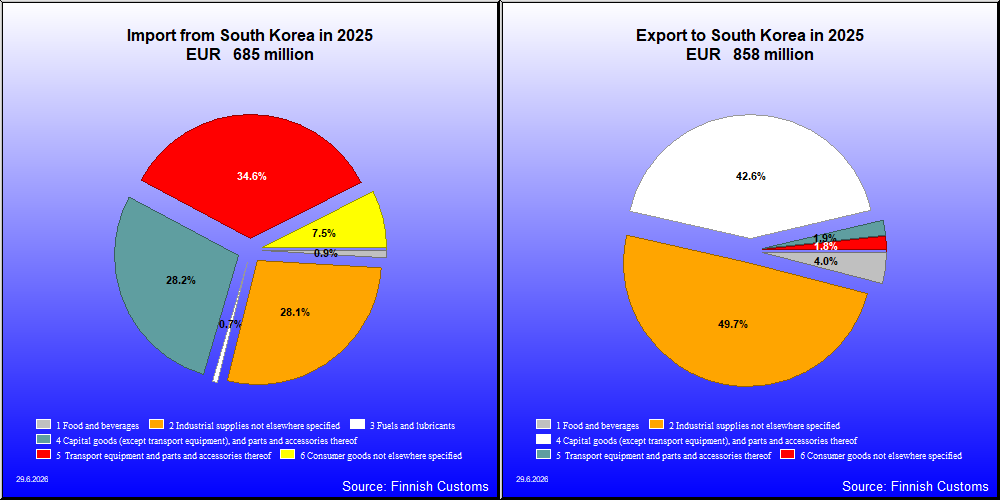

| 2021 | 2022 | 2023 | 2024 | 2025 | ||||||
|---|---|---|---|---|---|---|---|---|---|---|
| 1,000 € | % | 1,000 € | % | 1,000 € | % | 1,000 € | % | 1,000 € | % | |
| 1. Food and beverages | 32,382 | 4.2 | 40,395 | 4.1 | 30,908 | 3.8 | 31,614 | 4.5 | 33,864 | 3.9 |
| 11. Food and beverages, primary | 204 | 0.0 | 20 | 0.0 | 45 | 0.0 | 143 | 0.0 | ||
| 111. Food and beverages, primary, mainly for industry | 182 | 0.0 | 1 | 0.0 | ||||||
| 112. Food and beverages, primary, mainly for household consumption | 22 | 0.0 | 20 | 0.0 | 44 | 0.0 | 143 | 0.0 | ||
| 12. Food and beverages, processed | 32,382 | 4.2 | 40,191 | 4.1 | 30,888 | 3.7 | 31,569 | 4.5 | 33,721 | 3.9 |
| 121. Food and beverages, processed, mainly for industry | 6,778 | 0.9 | 8,531 | 0.9 | 4,850 | 0.6 | 5,227 | 0.7 | 5,493 | 0.6 |
| 122. Food and beverages, processed, mainly for household consumption | 25,604 | 3.4 | 31,661 | 3.2 | 26,037 | 3.2 | 26,341 | 3.8 | 28,228 | 3.3 |
| 2. Industrial supplies not elsewhere specified | 408,547 | 53.5 | 480,713 | 49.0 | 373,925 | 45.4 | 268,955 | 38.5 | 425,380 | 49.6 |
| 21. Industrial supplies not elsewhere specified, primary | 10,692 | 1.4 | 12,419 | 1.3 | 10,151 | 1.2 | 7,699 | 1.1 | 6,283 | 0.7 |
| 22. Industrial supplies not elsewhere specified, processed | 397,855 | 52.1 | 468,294 | 47.7 | 363,774 | 44.2 | 261,256 | 37.4 | 419,097 | 48.8 |
| 3. Fuels and lubricants | 22 | 0.0 | 171 | 0.0 | 131 | 0.0 | 29 | 0.0 | 14 | 0.0 |
| 31. Fuels and lubricants, primary | 50 | 0.0 | 12 | 0.0 | ||||||
| 32. Fuels and lubricants, processed | 22 | 0.0 | 121 | 0.0 | 131 | 0.0 | 17 | 0.0 | 14 | 0.0 |
| 321. Fuels and lubricants, motor spirit | 15 | 0.0 | ||||||||
| 322. Fuels and lubricants, other | 6 | 0.0 | 121 | 0.0 | 131 | 0.0 | 17 | 0.0 | 14 | 0.0 |
| 4. Capital goods (except transport equipment), and parts and accessories thereof | 268,756 | 35.2 | 425,200 | 43.3 | 382,746 | 46.5 | 350,747 | 50.2 | 364,820 | 42.5 |
| 41. Capital goods (except transport equipment) | 178,465 | 23.4 | 318,059 | 32.4 | 263,269 | 32.0 | 273,757 | 39.2 | 277,472 | 32.3 |
| 42. Capital goods (except transport equipment), parts and accessories | 90,291 | 11.8 | 107,141 | 10.9 | 119,477 | 14.5 | 76,990 | 11.0 | 87,348 | 10.2 |
| 5. Transport equipment and parts and accessories thereof | 30,869 | 4.0 | 16,665 | 1.7 | 17,458 | 2.1 | 29,542 | 4.2 | 16,569 | 1.9 |
| 52. Transport equipment, other than passenger motor vehicles | 615 | 0.1 | 2,631 | 0.3 | 5,347 | 0.6 | 1,138 | 0.2 | 1,853 | 0.2 |
| 521. Transport equipment, other than passenger motor vehicles, industrial | 605 | 0.1 | 586 | 0.1 | 2,714 | 0.3 | 956 | 0.1 | 1,606 | 0.2 |
| 522. Transport equipment, other than passenger motor vehicles, non-industrial | 10 | 0.0 | 2,044 | 0.2 | 2,633 | 0.3 | 182 | 0.0 | 366 | 0.0 |
| 53. Transport equipment, parts and accessories | 30,254 | 4.0 | 14,034 | 1.4 | 12,111 | 1.5 | 28,404 | 4.1 | 14,716 | 1.7 |
| 6. Consumer goods not elsewhere specified | 22,160 | 2.9 | 17,370 | 1.8 | 18,632 | 2.3 | 17,580 | 2.5 | 15,815 | 1.8 |
| 61. Consumer goods not elsewhere specified, durable | 6,103 | 0.8 | 1,719 | 0.2 | 1,075 | 0.1 | 1,175 | 0.2 | 1,731 | 0.2 |
| 62. Consumer goods not elsewhere specified, semi-durable | 6,472 | 0.8 | 6,213 | 0.6 | 5,454 | 0.7 | 5,312 | 0.8 | 4,703 | 0.5 |
| 63. Consumer goods not elsewhere specified, non-durable | 9,585 | 1.3 | 9,437 | 1.0 | 12,103 | 1.5 | 11,093 | 1.6 | 9,381 | 1.1 |
| 7. Goods not elsewhere specified | 329 | 0.0 | 360 | 0.0 | 98 | 0.0 | 43 | 0.0 | 1,722 | 0.2 |
| All groups | 763,065 | 100.0 | 980,874 | 100.0 | 823,898 | 100.0 | 698,509 | 100.0 | 858,184 | 100.0 |
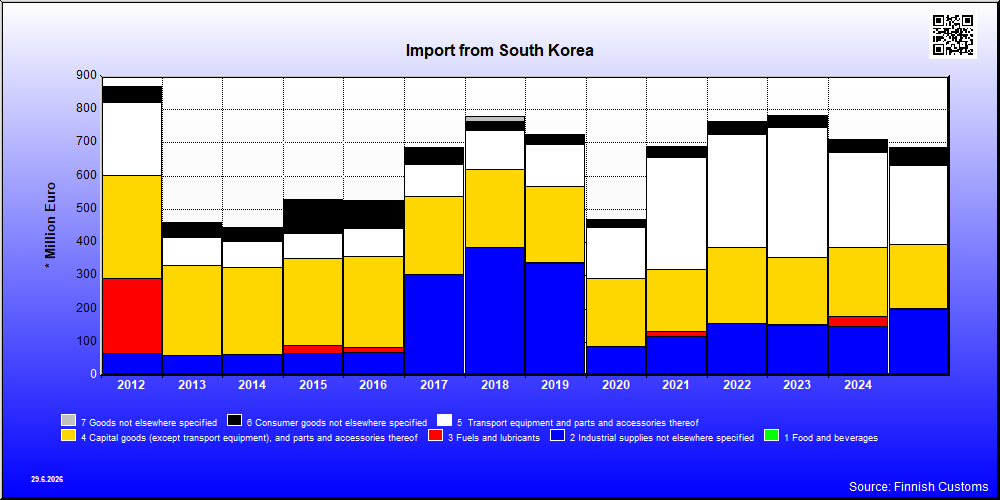
| 2021 | 2022 | 2023 | 2024 | 2025 | ||||||
|---|---|---|---|---|---|---|---|---|---|---|
| 1,000 € | % | 1,000 € | % | 1,000 € | % | 1,000 € | % | 1,000 € | % | |
| 1. Food and beverages | 1,983 | 0.3 | 2,296 | 0.3 | 2,173 | 0.3 | 3,104 | 0.4 | 5,848 | 0.9 |
| 11. Food and beverages, primary | 78 | 0.0 | 81 | 0.0 | 119 | 0.0 | 143 | 0.0 | 150 | 0.0 |
| 111. Food and beverages, primary, mainly for industry | 2 | 0.0 | 1 | 0.0 | 4 | 0.0 | 1 | 0.0 | ||
| 112. Food and beverages, primary, mainly for household consumption | 76 | 0.0 | 80 | 0.0 | 115 | 0.0 | 142 | 0.0 | 150 | 0.0 |
| 12. Food and beverages, processed | 1,905 | 0.3 | 2,214 | 0.3 | 2,054 | 0.3 | 2,962 | 0.4 | 5,698 | 0.8 |
| 121. Food and beverages, processed, mainly for industry | 23 | 0.0 | 12 | 0.0 | 63 | 0.0 | 90 | 0.0 | 37 | 0.0 |
| 122. Food and beverages, processed, mainly for household consumption | 1,882 | 0.3 | 2,202 | 0.3 | 1,991 | 0.3 | 2,872 | 0.4 | 5,661 | 0.8 |
| 2. Industrial supplies not elsewhere specified | 115,197 | 16.7 | 155,036 | 20.2 | 148,824 | 19.0 | 143,961 | 20.3 | 192,308 | 28.1 |
| 21. Industrial supplies not elsewhere specified, primary | 176 | 0.0 | 1,205 | 0.2 | 233 | 0.0 | 187 | 0.0 | 117 | 0.0 |
| 22. Industrial supplies not elsewhere specified, processed | 115,020 | 16.7 | 153,831 | 20.1 | 148,591 | 19.0 | 143,774 | 20.3 | 192,191 | 28.0 |
| 3. Fuels and lubricants | 16,551 | 2.4 | 383 | 0.0 | 1,055 | 0.1 | 29,570 | 4.2 | 4,827 | 0.7 |
| 31. Fuels and lubricants, primary | 179 | 0.0 | 260 | 0.0 | 121 | 0.0 | ||||
| 32. Fuels and lubricants, processed | 16,373 | 2.4 | 123 | 0.0 | 934 | 0.1 | 29,570 | 4.2 | 4,826 | 0.7 |
| 321. Fuels and lubricants, motor spirit | 16,135 | 2.3 | 17,589 | 2.5 | ||||||
| 322. Fuels and lubricants, other | 237 | 0.0 | 123 | 0.0 | 934 | 0.1 | 17,463 | 2.5 | 4,826 | 0.7 |
| 4. Capital goods (except transport equipment), and parts and accessories thereof | 184,737 | 26.8 | 227,461 | 29.7 | 202,675 | 25.9 | 207,925 | 29.3 | 192,689 | 28.1 |
| 41. Capital goods (except transport equipment) | 124,896 | 18.1 | 186,548 | 24.4 | 164,731 | 21.0 | 140,274 | 19.8 | 88,689 | 12.9 |
| 42. Capital goods (except transport equipment), parts and accessories | 59,841 | 8.7 | 40,912 | 5.3 | 37,944 | 4.8 | 67,650 | 9.5 | 103,999 | 15.2 |
| 5. Transport equipment and parts and accessories thereof | 338,935 | 49.3 | 339,857 | 44.4 | 392,825 | 50.1 | 285,571 | 40.2 | 237,099 | 34.6 |
| 51. Passenger motor vehicles | 119,509 | 17.4 | 126,957 | 16.6 | 200,773 | 25.6 | 141,983 | 20.0 | 123,876 | 18.1 |
| 52. Transport equipment, other than passenger motor vehicles | 124,495 | 18.1 | 312 | 0.0 | 1,014 | 0.1 | 747 | 0.1 | 2,530 | 0.4 |
| 521. Transport equipment, other than passenger motor vehicles, industrial | 124,372 | 18.1 | 312 | 0.0 | 1,014 | 0.1 | 747 | 0.1 | 2,530 | 0.4 |
| 522. Transport equipment, other than passenger motor vehicles, non-industrial | 124 | 0.0 | ||||||||
| 53. Transport equipment, parts and accessories | 94,931 | 13.8 | 212,587 | 27.8 | 191,037 | 24.4 | 142,841 | 20.1 | 110,694 | 16.2 |
| 6. Consumer goods not elsewhere specified | 28,405 | 4.1 | 36,120 | 4.7 | 35,332 | 4.5 | 38,900 | 5.5 | 51,571 | 7.5 |
| 61. Consumer goods not elsewhere specified, durable | 9,177 | 1.3 | 13,970 | 1.8 | 11,101 | 1.4 | 7,999 | 1.1 | 8,942 | 1.3 |
| 62. Consumer goods not elsewhere specified, semi-durable | 7,547 | 1.1 | 10,185 | 1.3 | 6,661 | 0.8 | 4,630 | 0.7 | 5,035 | 0.7 |
| 63. Consumer goods not elsewhere specified, non-durable | 11,680 | 1.7 | 11,965 | 1.6 | 17,570 | 2.2 | 26,272 | 3.7 | 37,593 | 5.5 |
| 7. Goods not elsewhere specified | 2,382 | 0.3 | 4,699 | 0.6 | 945 | 0.1 | 921 | 0.1 | 962 | 0.1 |
| All groups | 688,189 | 100.0 | 765,851 | 100.0 | 783,827 | 100.0 | 709,953 | 100.0 | 685,304 | 100.0 |
| Classification | Description | Year level | Quarter level | Month level | |
|---|---|---|---|---|---|
| SITC | Standard International Trade Classification (classification system is maintained by the United Nations) | ███ | ███ | ███ | |
| BEC | The standard of statistical classification of BEC (Broad Economic Categories) is upheld by the UN and it is based on SITC-nomenclature. | ███ | ███ | ███ | |
| NACE | National industrial classification based on Statistical Classification of Economic Activities in the European Community Nomenclature générale des Activités économiques dans les Communautés européennes | ███ | ███ | ███ | |
| CPA | CPA = Classification of Products by Activities | ███ | ███ | ███ | |
| CN | The Combined Nomenclature is the common nomenclature of the European Community. | ███ | ███ | ███ |