
| Export of goods from Finland and import to Finland | BEC (Broad Economic Categories) |
*) The standard of statistical classification of BEC (Broad Economic Categories) is upheld by the UN and it is based on SITC-nomenclature.
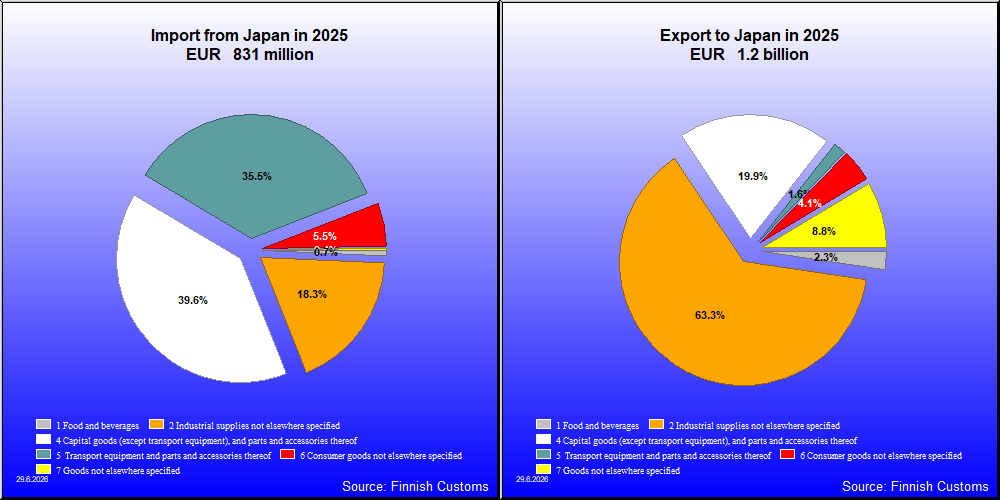

| 2021 | 2022 | 2023 | 2024 | 2025 | ||||||
|---|---|---|---|---|---|---|---|---|---|---|
| 1,000 € | % | 1,000 € | % | 1,000 € | % | 1,000 € | % | 1,000 € | % | |
| 1. Food and beverages | 21,960 | 1.4 | 31,180 | 1.7 | 27,968 | 2.3 | 26,042 | 2.4 | 28,605 | 2.3 |
| 11. Food and beverages, primary | 2,453 | 0.2 | 3,929 | 0.2 | 6,050 | 0.5 | 2,333 | 0.2 | 1,324 | 0.1 |
| 111. Food and beverages, primary, mainly for industry | 319 | 0.0 | 107 | 0.0 | 35 | 0.0 | 41 | 0.0 | 21 | 0.0 |
| 112. Food and beverages, primary, mainly for household consumption | 2,134 | 0.1 | 3,823 | 0.2 | 6,014 | 0.5 | 2,292 | 0.2 | 1,303 | 0.1 |
| 12. Food and beverages, processed | 19,507 | 1.2 | 27,251 | 1.5 | 21,919 | 1.8 | 23,710 | 2.2 | 27,281 | 2.2 |
| 121. Food and beverages, processed, mainly for industry | 6,079 | 0.4 | 10,241 | 0.6 | 10,356 | 0.8 | 9,735 | 0.9 | 11,193 | 0.9 |
| 122. Food and beverages, processed, mainly for household consumption | 13,428 | 0.8 | 17,010 | 1.0 | 11,562 | 0.9 | 13,975 | 1.3 | 16,088 | 1.3 |
| 2. Industrial supplies not elsewhere specified | 1,226,280 | 76.7 | 1,453,244 | 81.3 | 803,346 | 65.0 | 696,932 | 65.4 | 782,975 | 63.2 |
| 21. Industrial supplies not elsewhere specified, primary | 1,429 | 0.1 | 2,274 | 0.1 | 1,736 | 0.1 | 1,983 | 0.2 | 2,464 | 0.2 |
| 22. Industrial supplies not elsewhere specified, processed | 1,224,851 | 76.6 | 1,450,970 | 81.2 | 801,611 | 64.9 | 694,949 | 65.2 | 780,511 | 63.0 |
| 3. Fuels and lubricants | 268 | 0.0 | 524 | 0.0 | 416 | 0.0 | 333 | 0.0 | 423 | 0.0 |
| 31. Fuels and lubricants, primary | 262 | 0.0 | 502 | 0.0 | 379 | 0.0 | 304 | 0.0 | 361 | 0.0 |
| 32. Fuels and lubricants, processed | 6 | 0.0 | 22 | 0.0 | 36 | 0.0 | 29 | 0.0 | 62 | 0.0 |
| 321. Fuels and lubricants, motor spirit | 2 | 0.0 | 2 | 0.0 | ||||||
| 322. Fuels and lubricants, other | 5 | 0.0 | 21 | 0.0 | 36 | 0.0 | 28 | 0.0 | 62 | 0.0 |
| 4. Capital goods (except transport equipment), and parts and accessories thereof | 267,680 | 16.7 | 228,728 | 12.8 | 317,170 | 25.7 | 251,435 | 23.6 | 246,679 | 19.9 |
| 41. Capital goods (except transport equipment) | 214,866 | 13.4 | 173,491 | 9.7 | 234,541 | 19.0 | 187,396 | 17.6 | 181,320 | 14.6 |
| 42. Capital goods (except transport equipment), parts and accessories | 52,814 | 3.3 | 55,237 | 3.1 | 82,629 | 6.7 | 64,038 | 6.0 | 65,359 | 5.3 |
| 5. Transport equipment and parts and accessories thereof | 19,210 | 1.2 | 15,561 | 0.9 | 12,534 | 1.0 | 13,805 | 1.3 | 20,130 | 1.6 |
| 51. Passenger motor vehicles | 64 | 0.0 | 71 | 0.0 | 177 | 0.0 | 2,250 | 0.2 | 111 | 0.0 |
| 52. Transport equipment, other than passenger motor vehicles | 6,003 | 0.4 | 2,517 | 0.1 | 6,234 | 0.5 | 2,561 | 0.2 | 5,083 | 0.4 |
| 521. Transport equipment, other than passenger motor vehicles, industrial | 610 | 0.0 | 1,113 | 0.1 | 2 | 0.0 | 172 | 0.0 | 1,189 | 0.1 |
| 522. Transport equipment, other than passenger motor vehicles, non-industrial | 5,393 | 0.3 | 1,403 | 0.1 | 6,232 | 0.5 | 2,389 | 0.2 | 3,894 | 0.3 |
| 53. Transport equipment, parts and accessories | 13,143 | 0.8 | 12,973 | 0.7 | 6,124 | 0.5 | 8,994 | 0.8 | 14,935 | 1.2 |
| 6. Consumer goods not elsewhere specified | 62,225 | 3.9 | 56,675 | 3.2 | 73,472 | 5.9 | 76,139 | 7.1 | 51,038 | 4.1 |
| 61. Consumer goods not elsewhere specified, durable | 2,423 | 0.2 | 2,576 | 0.1 | 2,834 | 0.2 | 2,872 | 0.3 | 2,963 | 0.2 |
| 62. Consumer goods not elsewhere specified, semi-durable | 19,529 | 1.2 | 18,953 | 1.1 | 18,419 | 1.5 | 16,012 | 1.5 | 19,750 | 1.6 |
| 63. Consumer goods not elsewhere specified, non-durable | 40,273 | 2.5 | 35,145 | 2.0 | 52,219 | 4.2 | 57,255 | 5.4 | 28,324 | 2.3 |
| 7. Goods not elsewhere specified | 1,257 | 0.1 | 798 | 0.0 | 1,046 | 0.1 | 1,528 | 0.1 | 108,383 | 8.8 |
| All groups | 1,598,879 | 100.0 | 1,786,710 | 100.0 | 1,235,952 | 100.0 | 1,066,215 | 100.0 | 1,238,232 | 100.0 |
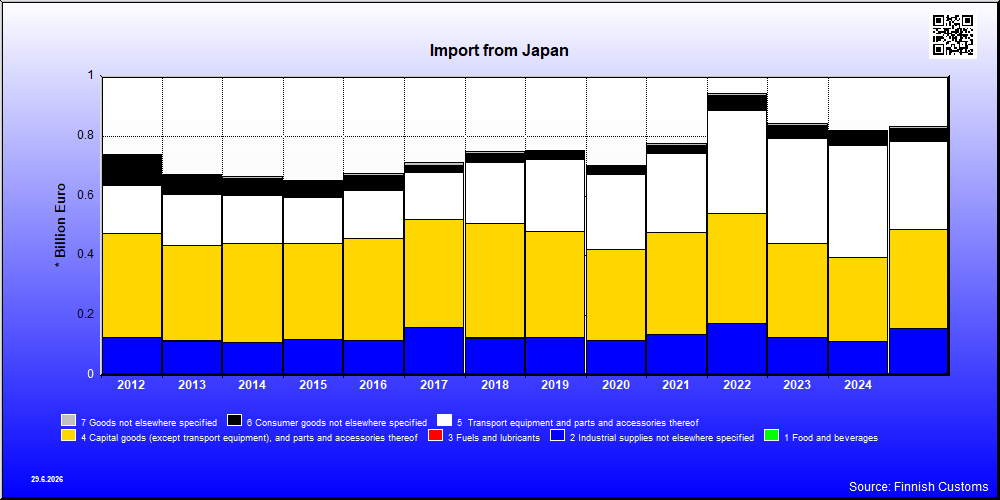
| 2021 | 2022 | 2023 | 2024 | 2025 | ||||||
|---|---|---|---|---|---|---|---|---|---|---|
| 1,000 € | % | 1,000 € | % | 1,000 € | % | 1,000 € | % | 1,000 € | % | |
| 1. Food and beverages | 4,186 | 0.5 | 4,437 | 0.5 | 4,589 | 0.5 | 5,623 | 0.7 | 5,474 | 0.7 |
| 11. Food and beverages, primary | 374 | 0.0 | 472 | 0.0 | 326 | 0.0 | 342 | 0.0 | 451 | 0.1 |
| 111. Food and beverages, primary, mainly for industry | 16 | 0.0 | 15 | 0.0 | 15 | 0.0 | 24 | 0.0 | 28 | 0.0 |
| 112. Food and beverages, primary, mainly for household consumption | 358 | 0.0 | 457 | 0.0 | 311 | 0.0 | 318 | 0.0 | 423 | 0.1 |
| 12. Food and beverages, processed | 3,812 | 0.5 | 3,966 | 0.4 | 4,263 | 0.5 | 5,281 | 0.6 | 5,023 | 0.6 |
| 121. Food and beverages, processed, mainly for industry | 58 | 0.0 | 33 | 0.0 | 49 | 0.0 | 84 | 0.0 | 72 | 0.0 |
| 122. Food and beverages, processed, mainly for household consumption | 3,754 | 0.5 | 3,932 | 0.4 | 4,214 | 0.5 | 5,197 | 0.6 | 4,951 | 0.6 |
| 2. Industrial supplies not elsewhere specified | 133,170 | 17.1 | 168,442 | 17.8 | 121,261 | 14.4 | 106,801 | 13.0 | 152,283 | 18.3 |
| 21. Industrial supplies not elsewhere specified, primary | 161 | 0.0 | 313 | 0.0 | 134 | 0.0 | 207 | 0.0 | 227 | 0.0 |
| 22. Industrial supplies not elsewhere specified, processed | 133,008 | 17.1 | 168,129 | 17.8 | 121,127 | 14.4 | 106,595 | 13.0 | 152,056 | 18.3 |
| 3. Fuels and lubricants | 362 | 0.0 | 450 | 0.0 | 474 | 0.1 | 567 | 0.1 | 553 | 0.1 |
| 31. Fuels and lubricants, primary | 56 | 0.0 | ||||||||
| 32. Fuels and lubricants, processed | 362 | 0.0 | 449 | 0.0 | 418 | 0.0 | 567 | 0.1 | 553 | 0.1 |
| 321. Fuels and lubricants, motor spirit | 279 | 0.0 | ||||||||
| 322. Fuels and lubricants, other | 83 | 0.0 | 449 | 0.0 | 418 | 0.0 | 567 | 0.1 | 553 | 0.1 |
| 4. Capital goods (except transport equipment), and parts and accessories thereof | 341,449 | 44.0 | 367,766 | 39.0 | 315,846 | 37.5 | 280,091 | 34.2 | 328,750 | 39.5 |
| 41. Capital goods (except transport equipment) | 227,861 | 29.3 | 247,654 | 26.2 | 208,835 | 24.8 | 159,533 | 19.5 | 197,605 | 23.8 |
| 42. Capital goods (except transport equipment), parts and accessories | 113,587 | 14.6 | 120,112 | 12.7 | 107,011 | 12.7 | 120,558 | 14.7 | 131,144 | 15.8 |
| 5. Transport equipment and parts and accessories thereof | 262,628 | 33.8 | 343,962 | 36.4 | 350,517 | 41.7 | 377,280 | 46.0 | 294,960 | 35.5 |
| 51. Passenger motor vehicles | 147,585 | 19.0 | 210,062 | 22.3 | 244,573 | 29.1 | 189,820 | 23.2 | 198,659 | 23.9 |
| 52. Transport equipment, other than passenger motor vehicles | 48,268 | 6.2 | 53,118 | 5.6 | 45,281 | 5.4 | 119,105 | 14.5 | 32,087 | 3.9 |
| 521. Transport equipment, other than passenger motor vehicles, industrial | 5,567 | 0.7 | 3,727 | 0.4 | 13,208 | 1.6 | 102,199 | 12.5 | 12,138 | 1.5 |
| 522. Transport equipment, other than passenger motor vehicles, non-industrial | 42,701 | 5.5 | 49,391 | 5.2 | 32,073 | 3.8 | 16,906 | 2.1 | 19,950 | 2.4 |
| 53. Transport equipment, parts and accessories | 66,774 | 8.6 | 80,781 | 8.6 | 60,663 | 7.2 | 68,355 | 8.3 | 64,213 | 7.7 |
| 6. Consumer goods not elsewhere specified | 28,251 | 3.6 | 51,337 | 5.4 | 44,919 | 5.3 | 45,752 | 5.6 | 45,693 | 5.5 |
| 61. Consumer goods not elsewhere specified, durable | 7,432 | 1.0 | 8,358 | 0.9 | 8,527 | 1.0 | 8,390 | 1.0 | 6,774 | 0.8 |
| 62. Consumer goods not elsewhere specified, semi-durable | 6,687 | 0.9 | 11,471 | 1.2 | 9,177 | 1.1 | 9,539 | 1.2 | 14,751 | 1.8 |
| 63. Consumer goods not elsewhere specified, non-durable | 14,132 | 1.8 | 31,508 | 3.3 | 27,215 | 3.2 | 27,823 | 3.4 | 24,168 | 2.9 |
| 7. Goods not elsewhere specified | 6,479 | 0.8 | 7,465 | 0.8 | 3,895 | 0.5 | 3,322 | 0.4 | 3,687 | 0.4 |
| All groups | 776,524 | 100.0 | 943,859 | 100.0 | 841,502 | 100.0 | 819,436 | 100.0 | 831,400 | 100.0 |
| Classification | Description | Year level | Quarter level | Month level | |
|---|---|---|---|---|---|
| SITC | Standard International Trade Classification (classification system is maintained by the United Nations) | ███ | ███ | ███ | |
| BEC | The standard of statistical classification of BEC (Broad Economic Categories) is upheld by the UN and it is based on SITC-nomenclature. | ███ | ███ | ███ | |
| NACE | National industrial classification based on Statistical Classification of Economic Activities in the European Community Nomenclature générale des Activités économiques dans les Communautés européennes | ███ | ███ | ███ | |
| CPA | CPA = Classification of Products by Activities | ███ | ███ | ███ | |
| CN | The Combined Nomenclature is the common nomenclature of the European Community. | ███ | ███ | ███ |