
| Export of goods from Finland and import to Finland | BEC (Broad Economic Categories) |
*) The standard of statistical classification of BEC (Broad Economic Categories) is upheld by the UN and it is based on SITC-nomenclature.

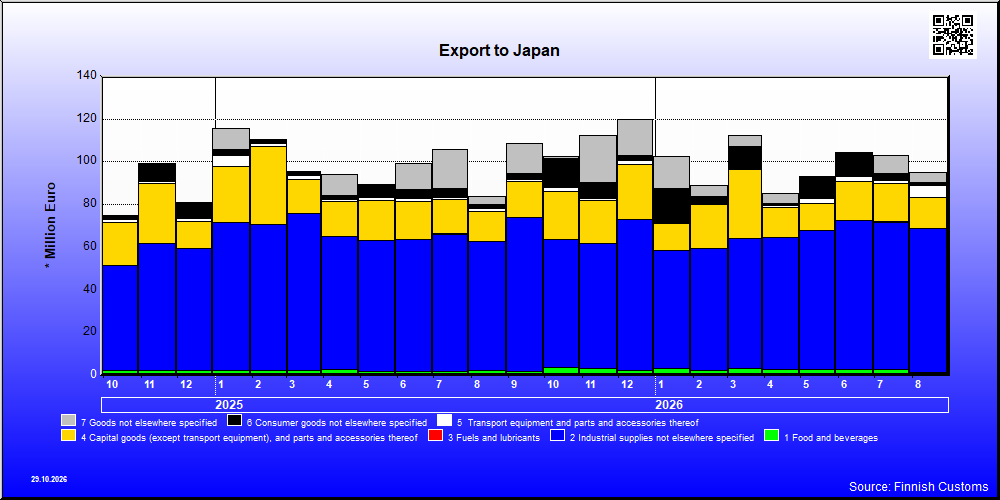
| 8 / 2026 | 8 / 2025 | Change from previous year's equal month % | ||
|---|---|---|---|---|
| 1,000 € | % | 1000 € | ||
| 1. Food and beverages | 1,380 | 1.5 | 2,501 | -44.8 |
| 11. Food and beverages, primary | 9 | 0.0 | 277 | -96.8 |
| 111. Food and beverages, primary, mainly for industry | 3 | 0.0 | 0 | .. |
| 112. Food and beverages, primary, mainly for household consumption | 6 | 0.0 | 277 | -97.8 |
| 12. Food and beverages, processed | 1,371 | 1.4 | 2,224 | -38.3 |
| 121. Food and beverages, processed, mainly for industry | 962 | 1.0 | 1,063 | -9.5 |
| 122. Food and beverages, processed, mainly for household consumption | 409 | 0.4 | 1,161 | -64.7 |
| 2. Industrial supplies not elsewhere specified | 67,616 | 71.3 | 60,364 | 12.0 |
| 21. Industrial supplies not elsewhere specified, primary | 75 | 0.1 | 101 | -26.1 |
| 22. Industrial supplies not elsewhere specified, processed | 67,541 | 71.2 | 60,262 | 12.1 |
| 3. Fuels and lubricants | 22 | 0.0 | 27 | -20.1 |
| 31. Fuels and lubricants, primary | 21 | 0.0 | 26 | -18.5 |
| 32. Fuels and lubricants, processed | 1 | 0.0 | 1 | -50.6 |
| 322. Fuels and lubricants, other | 1 | 0.0 | 1 | -50.6 |
| 4. Capital goods (except transport equipment), and parts and accessories thereof | 14,419 | 15.2 | 14,029 | 2.8 |
| 41. Capital goods (except transport equipment) | 9,967 | 10.5 | 9,153 | 8.9 |
| 42. Capital goods (except transport equipment), parts and accessories | 4,452 | 4.7 | 4,876 | -8.7 |
| 5. Transport equipment and parts and accessories thereof | 5,391 | 5.7 | 1,500 | 259.5 |
| 52. Transport equipment, other than passenger motor vehicles | 4,867 | 5.1 | 951 | 412.0 |
| 521. Transport equipment, other than passenger motor vehicles, industrial | 3,035 | 3.2 | 0 | .. |
| 522. Transport equipment, other than passenger motor vehicles, non-industrial | 1,832 | 1.9 | 951 | 92.7 |
| 53. Transport equipment, parts and accessories | 525 | 0.6 | 549 | -4.5 |
| 6. Consumer goods not elsewhere specified | 1,581 | 1.7 | 1,743 | -9.3 |
| 61. Consumer goods not elsewhere specified, durable | 194 | 0.2 | 106 | 82.6 |
| 62. Consumer goods not elsewhere specified, semi-durable | 1,119 | 1.2 | 1,398 | -19.9 |
| 63. Consumer goods not elsewhere specified, non-durable | 268 | 0.3 | 239 | 12.1 |
| 7. Goods not elsewhere specified | 4,445 | 4.7 | 3,878 | 14.6 |
| All groups | 94,855 | 100.0 | 84,041 | 12.9 |
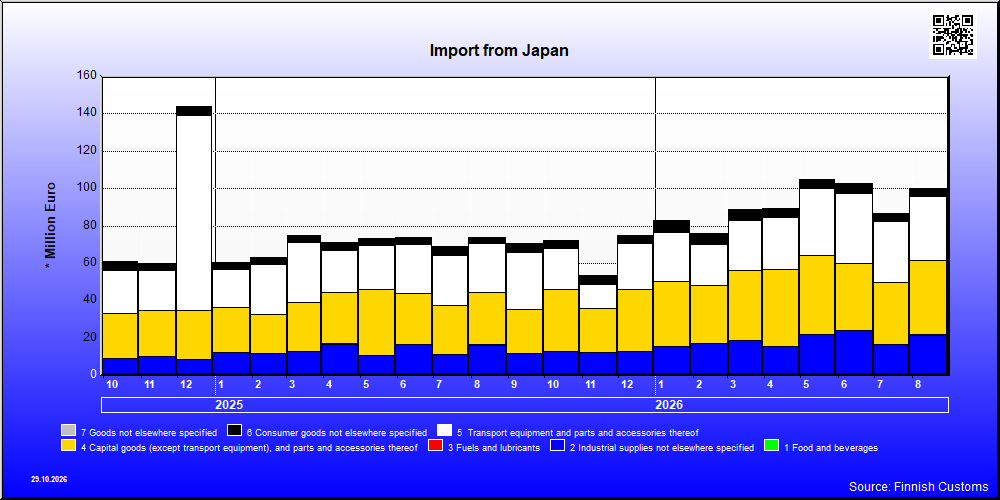
| 8 / 2026 | 8 / 2025 | Change from previous year's equal month % | ||
|---|---|---|---|---|
| 1,000 € | % | 1,000 € | ||
| 1. Food and beverages | 829 | 0.8 | 439 | 89.0 |
| 11. Food and beverages, primary | 83 | 0.1 | 51 | 62.2 |
| 111. Food and beverages, primary, mainly for industry | 0 | 0 | 7 | .. |
| 112. Food and beverages, primary, mainly for household consumption | 83 | 0.1 | 44 | 88.3 |
| 12. Food and beverages, processed | 746 | 0.7 | 388 | 92.5 |
| 121. Food and beverages, processed, mainly for industry | 8 | 0.0 | 10 | -21.1 |
| 122. Food and beverages, processed, mainly for household consumption | 738 | 0.7 | 378 | 95.5 |
| 2. Industrial supplies not elsewhere specified | 20,766 | 20.7 | 15,795 | 31.5 |
| 21. Industrial supplies not elsewhere specified, primary | 99 | 0.1 | 24 | 318.9 |
| 22. Industrial supplies not elsewhere specified, processed | 20,667 | 20.6 | 15,772 | 31.0 |
| 3. Fuels and lubricants | 86 | 0.1 | 90 | -4.4 |
| 31. Fuels and lubricants, primary | 0 | 0 | 0 | .. |
| 32. Fuels and lubricants, processed | 86 | 0.1 | 90 | -4.4 |
| 322. Fuels and lubricants, other | 86 | 0.1 | 90 | -4.4 |
| 4. Capital goods (except transport equipment), and parts and accessories thereof | 40,013 | 39.9 | 28,155 | 42.1 |
| 41. Capital goods (except transport equipment) | 25,760 | 25.7 | 14,436 | 78.4 |
| 42. Capital goods (except transport equipment), parts and accessories | 14,252 | 14.2 | 13,719 | 3.9 |
| 5. Transport equipment and parts and accessories thereof | 33,956 | 33.9 | 26,105 | 30.1 |
| 51. Passenger motor vehicles | 25,864 | 25.8 | 14,066 | 83.9 |
| 52. Transport equipment, other than passenger motor vehicles | 1,618 | 1.6 | 3,290 | -50.8 |
| 521. Transport equipment, other than passenger motor vehicles, industrial | 135 | 0.1 | 2,610 | -94.8 |
| 522. Transport equipment, other than passenger motor vehicles, non-industrial | 1,483 | 1.5 | 679 | 118.3 |
| 53. Transport equipment, parts and accessories | 6,473 | 6.5 | 8,749 | -26.0 |
| 6. Consumer goods not elsewhere specified | 4,276 | 4.3 | 3,166 | 35.1 |
| 61. Consumer goods not elsewhere specified, durable | 550 | 0.5 | 418 | 31.7 |
| 62. Consumer goods not elsewhere specified, semi-durable | 1,479 | 1.5 | 872 | 69.6 |
| 63. Consumer goods not elsewhere specified, non-durable | 2,247 | 2.2 | 1,876 | 19.8 |
| 7. Goods not elsewhere specified | 294 | 0.3 | 327 | -10.0 |
| All groups | 100,220 | 100.0 | 74,077 | 35.3 |
| Classification | Description | Year level | Quarter level | Month level | Year 2026 sofar |
|---|---|---|---|---|---|
| SITC | Standard International Trade Classification (classification system is maintained by the United Nations) | ███ | ███ | ███ | ███ |
| BEC | The standard of statistical classification of BEC (Broad Economic Categories) is upheld by the UN and it is based on SITC-nomenclature. | ███ | ███ | ███ | ███ |
| NACE | National industrial classification based on Statistical Classification of Economic Activities in the European Community Nomenclature générale des Activités économiques dans les Communautés européennes | ███ | ███ | ███ | ███ |
| CPA | CPA = Classification of Products by Activities | ███ | ███ | ███ | ███ |
| CN | The Combined Nomenclature is the common nomenclature of the European Community. | ███ | ███ | ███ | ███ |