
| Export of goods from Finland and import to Finland | BEC (Broad Economic Categories) |
*) The standard of statistical classification of BEC (Broad Economic Categories) is upheld by the UN and it is based on SITC-nomenclature.

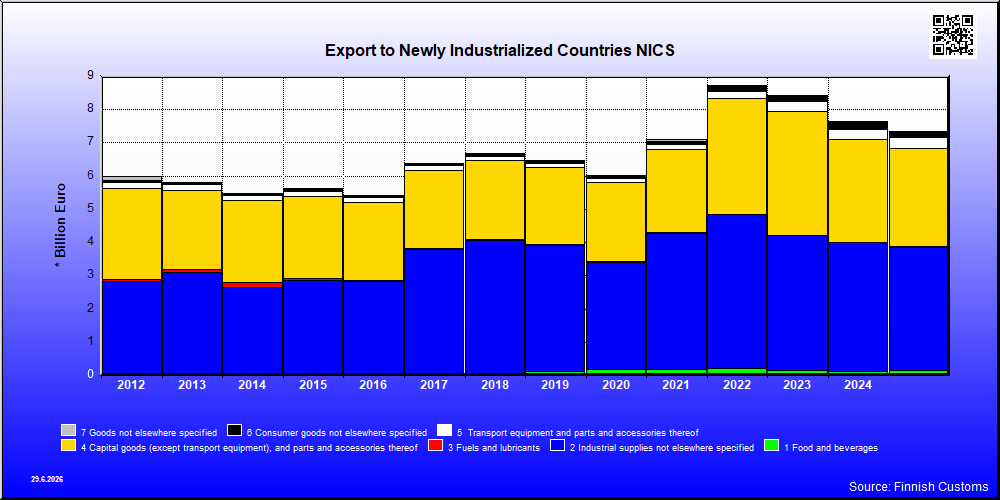
| 2021 | 2022 | 2023 | 2024 | 2025 | ||||||
|---|---|---|---|---|---|---|---|---|---|---|
| 1,000 € | % | 1,000 € | % | 1,000 € | % | 1,000 € | % | 1,000 € | % | |
| 1. Food and beverages | 169,772 | 2.4 | 200,246 | 2.3 | 146,559 | 1.7 | 131,028 | 1.7 | 143,799 | 2.0 |
| 11. Food and beverages, primary | 5,800 | 0.1 | 10,512 | 0.1 | 8,548 | 0.1 | 5,462 | 0.1 | 7,568 | 0.1 |
| 111. Food and beverages, primary, mainly for industry | 50 | 0.0 | 7 | 0.0 | 25 | 0.0 | 188 | 0.0 | 7 | 0.0 |
| 112. Food and beverages, primary, mainly for household consumption | 5,750 | 0.1 | 10,505 | 0.1 | 8,523 | 0.1 | 5,274 | 0.1 | 7,561 | 0.1 |
| 12. Food and beverages, processed | 163,972 | 2.3 | 189,734 | 2.2 | 138,011 | 1.6 | 125,566 | 1.6 | 136,231 | 1.9 |
| 121. Food and beverages, processed, mainly for industry | 102,108 | 1.4 | 142,696 | 1.6 | 100,955 | 1.2 | 90,641 | 1.2 | 88,372 | 1.2 |
| 122. Food and beverages, processed, mainly for household consumption | 61,864 | 0.9 | 47,038 | 0.5 | 37,056 | 0.4 | 34,925 | 0.5 | 47,859 | 0.7 |
| 2. Industrial supplies not elsewhere specified | 4,097,456 | 57.7 | 4,651,368 | 53.4 | 4,056,782 | 48.2 | 3,857,613 | 50.5 | 3,720,019 | 50.6 |
| 21. Industrial supplies not elsewhere specified, primary | 553,475 | 7.8 | 564,162 | 6.5 | 455,293 | 5.4 | 638,271 | 8.4 | 514,908 | 7.0 |
| 22. Industrial supplies not elsewhere specified, processed | 3,543,981 | 49.9 | 4,087,206 | 46.9 | 3,601,490 | 42.8 | 3,219,342 | 42.1 | 3,205,111 | 43.6 |
| 3. Fuels and lubricants | 36,565 | 0.5 | 8,638 | 0.1 | 5,913 | 0.1 | 10,712 | 0.1 | 10,344 | 0.1 |
| 31. Fuels and lubricants, primary | 2,904 | 0.0 | 5,439 | 0.1 | 4,424 | 0.1 | 5,379 | 0.1 | 8,738 | 0.1 |
| 32. Fuels and lubricants, processed | 33,662 | 0.5 | 3,198 | 0.0 | 1,489 | 0.0 | 5,333 | 0.1 | 1,605 | 0.0 |
| 321. Fuels and lubricants, motor spirit | 33,283 | 0.5 | 40 | 0.0 | 4,889 | 0.1 | ||||
| 322. Fuels and lubricants, other | 378 | 0.0 | 3,198 | 0.0 | 1,449 | 0.0 | 3,790 | 0.0 | 1,605 | 0.0 |
| 4. Capital goods (except transport equipment), and parts and accessories thereof | 2,484,219 | 35.0 | 3,486,942 | 40.0 | 3,730,959 | 44.3 | 3,111,695 | 40.7 | 2,962,228 | 40.3 |
| 41. Capital goods (except transport equipment) | 1,658,319 | 23.3 | 2,474,913 | 28.4 | 2,566,639 | 30.5 | 2,008,039 | 26.3 | 1,888,575 | 25.7 |
| 42. Capital goods (except transport equipment), parts and accessories | 825,900 | 11.6 | 1,012,029 | 11.6 | 1,164,321 | 13.8 | 1,103,657 | 14.4 | 1,073,653 | 14.6 |
| 5. Transport equipment and parts and accessories thereof | 179,888 | 2.5 | 206,092 | 2.4 | 293,967 | 3.5 | 295,248 | 3.9 | 322,434 | 4.4 |
| 51. Passenger motor vehicles | 21 | 0.0 | 104 | 0.0 | 1,329 | 0.0 | 86 | 0.0 | 595 | 0.0 |
| 52. Transport equipment, other than passenger motor vehicles | 92,681 | 1.3 | 127,709 | 1.5 | 127,671 | 1.5 | 103,678 | 1.4 | 74,924 | 1.0 |
| 521. Transport equipment, other than passenger motor vehicles, industrial | 90,991 | 1.3 | 120,684 | 1.4 | 116,041 | 1.4 | 84,974 | 1.1 | 61,941 | 0.8 |
| 522. Transport equipment, other than passenger motor vehicles, non-industrial | 1,690 | 0.0 | 7,025 | 0.1 | 11,629 | 0.1 | 18,704 | 0.2 | 12,983 | 0.2 |
| 53. Transport equipment, parts and accessories | 87,186 | 1.2 | 78,279 | 0.9 | 164,968 | 2.0 | 191,484 | 2.5 | 246,916 | 3.4 |
| 6. Consumer goods not elsewhere specified | 90,583 | 1.3 | 158,814 | 1.8 | 179,852 | 2.1 | 224,928 | 2.9 | 171,708 | 2.3 |
| 61. Consumer goods not elsewhere specified, durable | 14,909 | 0.2 | 19,350 | 0.2 | 19,961 | 0.2 | 18,521 | 0.2 | 18,092 | 0.2 |
| 62. Consumer goods not elsewhere specified, semi-durable | 26,473 | 0.4 | 42,782 | 0.5 | 43,932 | 0.5 | 51,998 | 0.7 | 55,028 | 0.7 |
| 63. Consumer goods not elsewhere specified, non-durable | 49,201 | 0.7 | 96,682 | 1.1 | 115,960 | 1.4 | 154,408 | 2.0 | 98,588 | 1.3 |
| 7. Goods not elsewhere specified | 44,012 | 0.6 | 3,602 | 0.0 | 3,255 | 0.0 | 8,410 | 0.1 | 28,303 | 0.4 |
| All groups | 7,102,496 | 100.0 | 8,715,702 | 100.0 | 8,417,287 | 100.0 | 7,639,634 | 100.0 | 7,358,835 | 100.0 |

| 2021 | 2022 | 2023 | 2024 | 2025 | ||||||
|---|---|---|---|---|---|---|---|---|---|---|
| 1,000 € | % | 1,000 € | % | 1,000 € | % | 1,000 € | % | 1,000 € | % | |
| 1. Food and beverages | 274,295 | 2.8 | 376,011 | 2.9 | 335,187 | 3.1 | 369,368 | 3.3 | 393,242 | 3.6 |
| 11. Food and beverages, primary | 145,926 | 1.5 | 181,740 | 1.4 | 163,629 | 1.5 | 193,597 | 1.8 | 219,836 | 2.0 |
| 111. Food and beverages, primary, mainly for industry | 74,859 | 0.8 | 120,551 | 0.9 | 95,240 | 0.9 | 118,564 | 1.1 | 148,634 | 1.4 |
| 112. Food and beverages, primary, mainly for household consumption | 71,066 | 0.7 | 61,190 | 0.5 | 68,389 | 0.6 | 75,033 | 0.7 | 71,203 | 0.6 |
| 12. Food and beverages, processed | 128,370 | 1.3 | 194,271 | 1.5 | 171,558 | 1.6 | 175,772 | 1.6 | 173,406 | 1.6 |
| 121. Food and beverages, processed, mainly for industry | 4,415 | 0.0 | 27,757 | 0.2 | 20,771 | 0.2 | 11,153 | 0.1 | 4,025 | 0.0 |
| 122. Food and beverages, processed, mainly for household consumption | 123,955 | 1.3 | 166,514 | 1.3 | 150,787 | 1.4 | 164,618 | 1.5 | 169,381 | 1.5 |
| 2. Industrial supplies not elsewhere specified | 2,422,625 | 24.6 | 3,076,704 | 23.7 | 2,449,447 | 22.6 | 2,159,997 | 19.6 | 2,125,839 | 19.3 |
| 21. Industrial supplies not elsewhere specified, primary | 391,846 | 4.0 | 598,707 | 4.6 | 486,218 | 4.5 | 437,075 | 4.0 | 516,576 | 4.7 |
| 22. Industrial supplies not elsewhere specified, processed | 2,030,779 | 20.6 | 2,477,996 | 19.1 | 1,963,229 | 18.1 | 1,722,922 | 15.6 | 1,609,263 | 14.6 |
| 3. Fuels and lubricants | 9,465 | 0.1 | 418,690 | 3.2 | 247,124 | 2.3 | 84,549 | 0.8 | 12,139 | 0.1 |
| 31. Fuels and lubricants, primary | 1 | 0.0 | 114,107 | 0.9 | 71,779 | 0.7 | 10,886 | 0.1 | ||
| 32. Fuels and lubricants, processed | 9,464 | 0.1 | 304,583 | 2.3 | 175,344 | 1.6 | 73,663 | 0.7 | 12,138 | 0.1 |
| 321. Fuels and lubricants, motor spirit | 5,730 | 0.1 | ||||||||
| 322. Fuels and lubricants, other | 3,734 | 0.0 | 304,583 | 2.3 | 175,344 | 1.6 | 73,662 | 0.7 | 12,138 | 0.1 |
| 4. Capital goods (except transport equipment), and parts and accessories thereof | 3,799,790 | 38.6 | 5,258,551 | 40.6 | 4,258,849 | 39.2 | 4,344,162 | 39.4 | 4,540,904 | 41.2 |
| 41. Capital goods (except transport equipment) | 2,717,694 | 27.6 | 3,731,486 | 28.8 | 3,099,911 | 28.5 | 3,126,837 | 28.3 | 3,403,053 | 30.9 |
| 42. Capital goods (except transport equipment), parts and accessories | 1,082,096 | 11.0 | 1,527,065 | 11.8 | 1,158,938 | 10.7 | 1,217,326 | 11.0 | 1,137,851 | 10.3 |
| 5. Transport equipment and parts and accessories thereof | 1,024,822 | 10.4 | 1,279,980 | 9.9 | 1,640,148 | 15.1 | 1,884,781 | 17.1 | 1,575,032 | 14.3 |
| 51. Passenger motor vehicles | 159,193 | 1.6 | 135,829 | 1.0 | 270,099 | 2.5 | 341,462 | 3.1 | 308,629 | 2.8 |
| 52. Transport equipment, other than passenger motor vehicles | 520,999 | 5.3 | 481,940 | 3.7 | 592,548 | 5.5 | 314,013 | 2.8 | 308,946 | 2.8 |
| 521. Transport equipment, other than passenger motor vehicles, industrial | 406,387 | 4.1 | 346,347 | 2.7 | 506,035 | 4.7 | 248,503 | 2.3 | 248,513 | 2.3 |
| 522. Transport equipment, other than passenger motor vehicles, non-industrial | 114,612 | 1.2 | 135,593 | 1.0 | 86,513 | 0.8 | 65,510 | 0.6 | 60,433 | 0.5 |
| 53. Transport equipment, parts and accessories | 344,630 | 3.5 | 662,212 | 5.1 | 777,501 | 7.2 | 1,229,312 | 11.1 | 957,457 | 8.7 |
| 6. Consumer goods not elsewhere specified | 2,140,871 | 21.7 | 2,439,690 | 18.8 | 1,884,504 | 17.4 | 2,011,600 | 18.2 | 2,125,503 | 19.3 |
| 61. Consumer goods not elsewhere specified, durable | 488,435 | 5.0 | 521,178 | 4.0 | 412,720 | 3.8 | 484,973 | 4.4 | 578,301 | 5.3 |
| 62. Consumer goods not elsewhere specified, semi-durable | 1,196,526 | 12.2 | 1,501,787 | 11.6 | 1,120,732 | 10.3 | 1,135,381 | 10.3 | 1,158,505 | 10.5 |
| 63. Consumer goods not elsewhere specified, non-durable | 455,910 | 4.6 | 416,725 | 3.2 | 351,052 | 3.2 | 391,247 | 3.5 | 388,696 | 3.5 |
| 7. Goods not elsewhere specified | 173,216 | 1.8 | 115,152 | 0.9 | 42,763 | 0.4 | 176,693 | 1.6 | 236,124 | 2.1 |
| All groups | 9,845,085 | 100.0 | 12,964,779 | 100.0 | 10,858,023 | 100.0 | 11,031,151 | 100.0 | 11,008,783 | 100.0 |
| Classification | Description | Year level | Quarter level | Month level | |
|---|---|---|---|---|---|
| SITC | Standard International Trade Classification (classification system is maintained by the United Nations) | ███ | ███ | ███ | |
| BEC | The standard of statistical classification of BEC (Broad Economic Categories) is upheld by the UN and it is based on SITC-nomenclature. | ███ | ███ | ███ | |
| NACE | National industrial classification based on Statistical Classification of Economic Activities in the European Community Nomenclature générale des Activités économiques dans les Communautés européennes | ███ | ███ | ███ | |
| CPA | CPA = Classification of Products by Activities | ███ | ███ | ███ | |
| CN | The Combined Nomenclature is the common nomenclature of the European Community. | ███ | ███ | ███ |