
| Export of goods from Finland and import to Finland | BEC (Broad Economic Categories) |
*) The standard of statistical classification of BEC (Broad Economic Categories) is upheld by the UN and it is based on SITC-nomenclature.
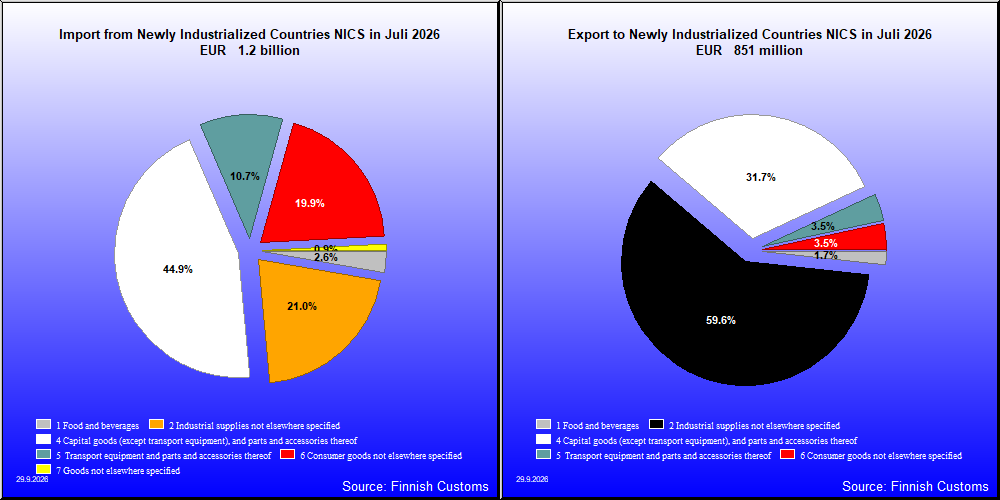
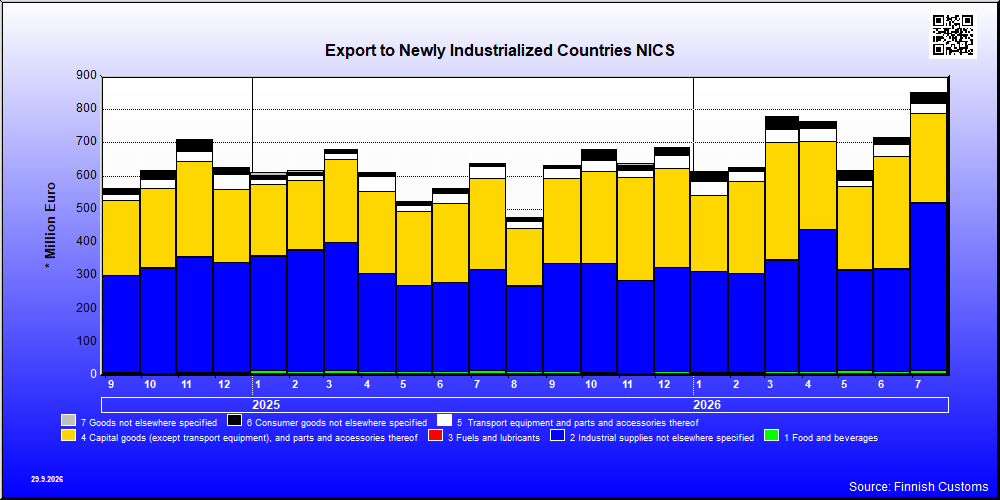
| 8 / 2026 | 8 / 2025 | Change from previous year's equal month % | ||
|---|---|---|---|---|
| 1,000 € | % | 1000 € | ||
| 1. Food and beverages | 12,301 | 2.1 | 11,584 | 6.2 |
| 11. Food and beverages, primary | 213 | 0.0 | 548 | -61.2 |
| 111. Food and beverages, primary, mainly for industry | 0 | 0.0 | 0 | -90.6 |
| 112. Food and beverages, primary, mainly for household consumption | 213 | 0.0 | 548 | -61.2 |
| 12. Food and beverages, processed | 12,088 | 2.1 | 11,036 | 9.5 |
| 121. Food and beverages, processed, mainly for industry | 9,240 | 1.6 | 6,737 | 37.2 |
| 122. Food and beverages, processed, mainly for household consumption | 2,849 | 0.5 | 4,299 | -33.7 |
| 2. Industrial supplies not elsewhere specified | 309,464 | 53.3 | 257,531 | 20.2 |
| 21. Industrial supplies not elsewhere specified, primary | 59,434 | 10.2 | 25,465 | 133.4 |
| 22. Industrial supplies not elsewhere specified, processed | 250,030 | 43.1 | 232,066 | 7.7 |
| 3. Fuels and lubricants | 838 | 0.1 | 819 | 2.4 |
| 31. Fuels and lubricants, primary | 817 | 0.1 | 425 | 92.0 |
| 32. Fuels and lubricants, processed | 22 | 0.0 | 393 | -94.5 |
| 322. Fuels and lubricants, other | 22 | 0.0 | 393 | -94.5 |
| 4. Capital goods (except transport equipment), and parts and accessories thereof | 216,442 | 37.3 | 173,754 | 24.6 |
| 41. Capital goods (except transport equipment) | 126,561 | 21.8 | 106,667 | 18.6 |
| 42. Capital goods (except transport equipment), parts and accessories | 89,881 | 15.5 | 67,087 | 34.0 |
| 5. Transport equipment and parts and accessories thereof | 20,152 | 3.5 | 20,166 | -0.1 |
| 52. Transport equipment, other than passenger motor vehicles | 9,153 | 1.6 | 5,089 | 79.9 |
| 521. Transport equipment, other than passenger motor vehicles, industrial | 7,858 | 1.4 | 4,361 | 80.2 |
| 522. Transport equipment, other than passenger motor vehicles, non-industrial | 1,295 | 0.2 | 728 | 77.9 |
| 53. Transport equipment, parts and accessories | 10,999 | 1.9 | 15,078 | -27.1 |
| 6. Consumer goods not elsewhere specified | 19,012 | 3.3 | 9,542 | 99.2 |
| 61. Consumer goods not elsewhere specified, durable | 879 | 0.2 | 2,622 | -66.5 |
| 62. Consumer goods not elsewhere specified, semi-durable | 5,060 | 0.9 | 3,130 | 61.7 |
| 63. Consumer goods not elsewhere specified, non-durable | 13,072 | 2.3 | 3,789 | 245.0 |
| 7. Goods not elsewhere specified | 2,027 | 0.3 | 1,668 | 21.5 |
| All groups | 580,236 | 100.0 | 475,064 | 22.1 |
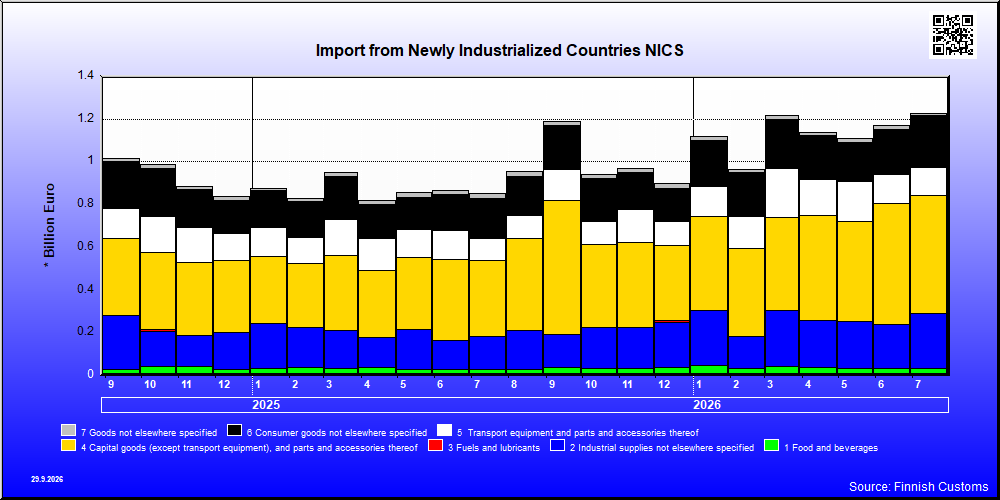
| 8 / 2026 | 8 / 2025 | Change from previous year's equal month % | ||
|---|---|---|---|---|
| 1,000 € | % | 1,000 € | ||
| 1. Food and beverages | 36,191 | 2.6 | 29,554 | 22.5 |
| 11. Food and beverages, primary | 20,410 | 1.5 | 16,348 | 24.8 |
| 111. Food and beverages, primary, mainly for industry | 13,202 | 0.9 | 9,748 | 35.4 |
| 112. Food and beverages, primary, mainly for household consumption | 7,208 | 0.5 | 6,600 | 9.2 |
| 12. Food and beverages, processed | 15,781 | 1.1 | 13,206 | 19.5 |
| 121. Food and beverages, processed, mainly for industry | 640 | 0.0 | 253 | 153.4 |
| 122. Food and beverages, processed, mainly for household consumption | 15,141 | 1.1 | 12,953 | 16.9 |
| 2. Industrial supplies not elsewhere specified | 225,157 | 16.2 | 180,820 | 24.5 |
| 21. Industrial supplies not elsewhere specified, primary | 21,694 | 1.6 | 51,179 | -57.6 |
| 22. Industrial supplies not elsewhere specified, processed | 203,464 | 14.6 | 129,641 | 56.9 |
| 3. Fuels and lubricants | 273 | 0.0 | 582 | -53.1 |
| 31. Fuels and lubricants, primary | 0 | 0.0 | 0 | .. |
| 32. Fuels and lubricants, processed | 273 | 0.0 | 582 | -53.1 |
| 322. Fuels and lubricants, other | 273 | 0.0 | 582 | -53.1 |
| 4. Capital goods (except transport equipment), and parts and accessories thereof | 743,462 | 53.3 | 428,182 | 73.6 |
| 41. Capital goods (except transport equipment) | 546,599 | 39.2 | 340,671 | 60.4 |
| 42. Capital goods (except transport equipment), parts and accessories | 196,863 | 14.1 | 87,511 | 125.0 |
| 5. Transport equipment and parts and accessories thereof | 123,182 | 8.8 | 109,042 | 13.0 |
| 51. Passenger motor vehicles | 23,345 | 1.7 | 19,564 | 19.3 |
| 52. Transport equipment, other than passenger motor vehicles | 20,769 | 1.5 | 14,853 | 39.8 |
| 521. Transport equipment, other than passenger motor vehicles, industrial | 18,168 | 1.3 | 13,681 | 32.8 |
| 522. Transport equipment, other than passenger motor vehicles, non-industrial | 2,601 | 0.2 | 1,172 | 121.9 |
| 53. Transport equipment, parts and accessories | 79,068 | 5.7 | 74,625 | 6.0 |
| 6. Consumer goods not elsewhere specified | 256,065 | 18.4 | 184,756 | 38.6 |
| 61. Consumer goods not elsewhere specified, durable | 54,650 | 3.9 | 40,570 | 34.7 |
| 62. Consumer goods not elsewhere specified, semi-durable | 153,532 | 11.0 | 108,472 | 41.5 |
| 63. Consumer goods not elsewhere specified, non-durable | 47,884 | 3.4 | 35,713 | 34.1 |
| 7. Goods not elsewhere specified | 9,717 | 0.7 | 22,488 | -56.8 |
| All groups | 1,394,047 | 100.0 | 955,423 | 45.9 |
| Classification | Description | Year level | Quarter level | Month level | Year 2026 sofar |
|---|---|---|---|---|---|
| SITC | Standard International Trade Classification (classification system is maintained by the United Nations) | ███ | ███ | ███ | ███ |
| BEC | The standard of statistical classification of BEC (Broad Economic Categories) is upheld by the UN and it is based on SITC-nomenclature. | ███ | ███ | ███ | ███ |
| NACE | National industrial classification based on Statistical Classification of Economic Activities in the European Community Nomenclature générale des Activités économiques dans les Communautés européennes | ███ | ███ | ███ | ███ |
| CPA | CPA = Classification of Products by Activities | ███ | ███ | ███ | ███ |
| CN | The Combined Nomenclature is the common nomenclature of the European Community. | ███ | ███ | ███ | ███ |