
| Export of goods from Finland and import to Finland | BEC (Broad Economic Categories) |
*) The standard of statistical classification of BEC (Broad Economic Categories) is upheld by the UN and it is based on SITC-nomenclature.

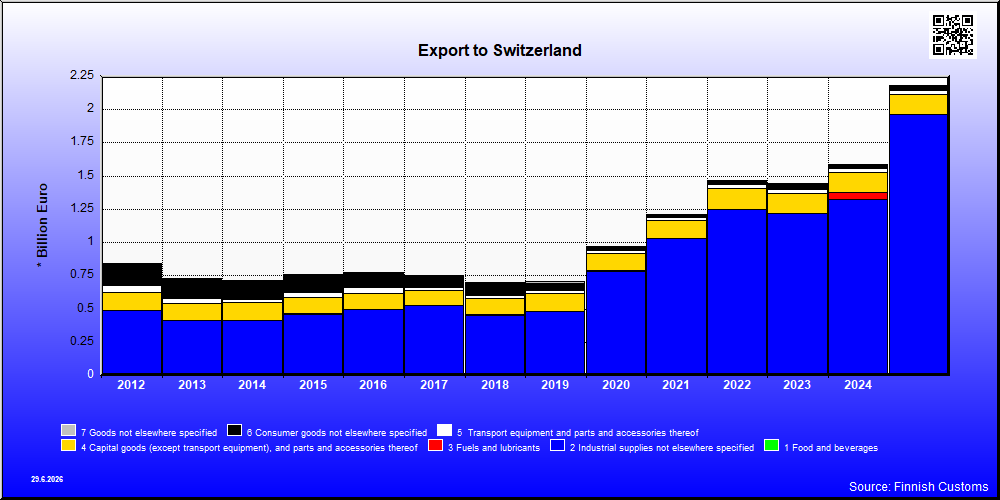
| 2021 | 2022 | 2023 | 2024 | 2025 | ||||||
|---|---|---|---|---|---|---|---|---|---|---|
| 1,000 € | % | 1,000 € | % | 1,000 € | % | 1,000 € | % | 1,000 € | % | |
| 1. Food and beverages | 14,668 | 1.2 | 15,793 | 1.1 | 12,620 | 0.9 | 14,639 | 0.9 | 15,528 | 0.7 |
| 11. Food and beverages, primary | 176 | 0.0 | 204 | 0.0 | 345 | 0.0 | 361 | 0.0 | 365 | 0.0 |
| 111. Food and beverages, primary, mainly for industry | 2 | 0.0 | 3 | 0.0 | 3 | 0.0 | 4 | 0.0 | 2 | 0.0 |
| 112. Food and beverages, primary, mainly for household consumption | 174 | 0.0 | 202 | 0.0 | 342 | 0.0 | 358 | 0.0 | 363 | 0.0 |
| 12. Food and beverages, processed | 14,492 | 1.2 | 15,589 | 1.1 | 12,276 | 0.9 | 14,278 | 0.9 | 15,163 | 0.7 |
| 121. Food and beverages, processed, mainly for industry | 1,736 | 0.1 | 1,399 | 0.1 | 985 | 0.1 | 841 | 0.1 | 1,026 | 0.0 |
| 122. Food and beverages, processed, mainly for household consumption | 12,756 | 1.1 | 14,190 | 1.0 | 11,291 | 0.8 | 13,437 | 0.8 | 14,137 | 0.6 |
| 2. Industrial supplies not elsewhere specified | 1,019,109 | 84.2 | 1,234,922 | 84.2 | 1,204,639 | 83.5 | 1,308,974 | 82.4 | 1,945,984 | 89.3 |
| 21. Industrial supplies not elsewhere specified, primary | 144,169 | 11.9 | 139,850 | 9.5 | 39,990 | 2.8 | 54,661 | 3.4 | 718,338 | 33.0 |
| 22. Industrial supplies not elsewhere specified, processed | 874,940 | 72.3 | 1,095,073 | 74.6 | 1,164,649 | 80.7 | 1,254,313 | 79.0 | 1,227,646 | 56.3 |
| 3. Fuels and lubricants | 364 | 0.0 | 508 | 0.0 | 1,069 | 0.1 | 55,620 | 3.5 | 52 | 0.0 |
| 31. Fuels and lubricants, primary | 4 | 0.0 | ||||||||
| 32. Fuels and lubricants, processed | 364 | 0.0 | 508 | 0.0 | 1,069 | 0.1 | 55,620 | 3.5 | 48 | 0.0 |
| 321. Fuels and lubricants, motor spirit | 362 | 0.0 | 475 | 0.0 | 373 | 0.0 | 25 | 0.0 | ||
| 322. Fuels and lubricants, other | 2 | 0.0 | 33 | 0.0 | 696 | 0.0 | 55,596 | 3.5 | 48 | 0.0 |
| 4. Capital goods (except transport equipment), and parts and accessories thereof | 134,171 | 11.1 | 154,127 | 10.5 | 148,421 | 10.3 | 145,182 | 9.1 | 153,630 | 7.1 |
| 41. Capital goods (except transport equipment) | 110,931 | 9.2 | 128,294 | 8.7 | 119,061 | 8.3 | 114,731 | 7.2 | 121,403 | 5.6 |
| 42. Capital goods (except transport equipment), parts and accessories | 23,240 | 1.9 | 25,833 | 1.8 | 29,360 | 2.0 | 30,451 | 1.9 | 32,226 | 1.5 |
| 5. Transport equipment and parts and accessories thereof | 16,935 | 1.4 | 33,277 | 2.3 | 36,366 | 2.5 | 34,496 | 2.2 | 26,205 | 1.2 |
| 51. Passenger motor vehicles | 785 | 0.1 | 860 | 0.1 | 518 | 0.0 | 879 | 0.1 | 810 | 0.0 |
| 52. Transport equipment, other than passenger motor vehicles | 9,373 | 0.8 | 23,108 | 1.6 | 23,247 | 1.6 | 14,809 | 0.9 | 12,979 | 0.6 |
| 521. Transport equipment, other than passenger motor vehicles, industrial | 1,300 | 0.1 | 2,887 | 0.2 | 3,383 | 0.2 | 3,237 | 0.2 | 9,930 | 0.5 |
| 522. Transport equipment, other than passenger motor vehicles, non-industrial | 8,073 | 0.7 | 20,221 | 1.4 | 19,863 | 1.4 | 11,572 | 0.7 | 3,049 | 0.1 |
| 53. Transport equipment, parts and accessories | 6,777 | 0.6 | 9,309 | 0.6 | 12,601 | 0.9 | 18,808 | 1.2 | 12,416 | 0.6 |
| 6. Consumer goods not elsewhere specified | 24,249 | 2.0 | 27,914 | 1.9 | 39,283 | 2.7 | 28,592 | 1.8 | 36,758 | 1.7 |
| 61. Consumer goods not elsewhere specified, durable | 3,591 | 0.3 | 3,717 | 0.3 | 5,108 | 0.4 | 3,785 | 0.2 | 6,254 | 0.3 |
| 62. Consumer goods not elsewhere specified, semi-durable | 14,629 | 1.2 | 11,781 | 0.8 | 12,537 | 0.9 | 12,533 | 0.8 | 17,963 | 0.8 |
| 63. Consumer goods not elsewhere specified, non-durable | 6,029 | 0.5 | 12,416 | 0.8 | 21,637 | 1.5 | 12,274 | 0.8 | 12,541 | 0.6 |
| 7. Goods not elsewhere specified | 200 | 0.0 | 508 | 0.0 | 392 | 0.0 | 518 | 0.0 | 649 | 0.0 |
| All groups | 1,209,696 | 100.0 | 1,467,049 | 100.0 | 1,442,790 | 100.0 | 1,588,022 | 100.0 | 2,178,805 | 100.0 |
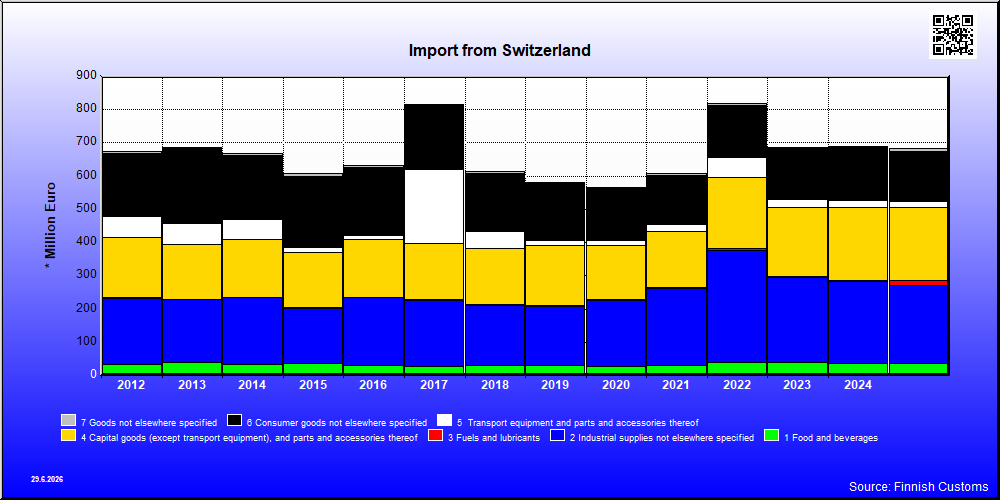
| 2021 | 2022 | 2023 | 2024 | 2025 | ||||||
|---|---|---|---|---|---|---|---|---|---|---|
| 1,000 € | % | 1,000 € | % | 1,000 € | % | 1,000 € | % | 1,000 € | % | |
| 1. Food and beverages | 29,323 | 4.8 | 38,909 | 4.8 | 38,020 | 5.5 | 36,083 | 5.2 | 36,778 | 5.4 |
| 11. Food and beverages, primary | 48 | 0.0 | 60 | 0.0 | 8 | 0.0 | 18 | 0.0 | 95 | 0.0 |
| 111. Food and beverages, primary, mainly for industry | 27 | 0.0 | 3 | 0.0 | 1 | 0.0 | 2 | 0.0 | 6 | 0.0 |
| 112. Food and beverages, primary, mainly for household consumption | 21 | 0.0 | 57 | 0.0 | 8 | 0.0 | 17 | 0.0 | 88 | 0.0 |
| 12. Food and beverages, processed | 29,275 | 4.8 | 38,849 | 4.7 | 38,012 | 5.5 | 36,065 | 5.2 | 36,684 | 5.4 |
| 121. Food and beverages, processed, mainly for industry | 2,840 | 0.5 | 2,402 | 0.3 | 2,966 | 0.4 | 3,702 | 0.5 | 7,736 | 1.1 |
| 122. Food and beverages, processed, mainly for household consumption | 26,435 | 4.3 | 36,447 | 4.5 | 35,046 | 5.1 | 32,363 | 4.7 | 28,948 | 4.2 |
| 2. Industrial supplies not elsewhere specified | 233,717 | 38.4 | 338,113 | 41.3 | 257,071 | 37.4 | 245,358 | 35.6 | 235,057 | 34.4 |
| 21. Industrial supplies not elsewhere specified, primary | 741 | 0.1 | 1,437 | 0.2 | 706 | 0.1 | 1,458 | 0.2 | 1,595 | 0.2 |
| 22. Industrial supplies not elsewhere specified, processed | 232,977 | 38.3 | 336,676 | 41.1 | 256,364 | 37.3 | 243,899 | 35.4 | 233,462 | 34.2 |
| 3. Fuels and lubricants | 2,804 | 0.5 | 5,884 | 0.7 | 3,249 | 0.5 | 3,462 | 0.5 | 14,683 | 2.2 |
| 31. Fuels and lubricants, primary | 7,195 | 0.9 | ||||||||
| 32. Fuels and lubricants, processed | 2,804 | 0.5 | 3,607 | 0.4 | 3,249 | 0.5 | 3,462 | 0.5 | 14,683 | 2.2 |
| 321. Fuels and lubricants, motor spirit | 1,854 | 0.3 | 11 | 0.0 | 44 | 0.0 | 231 | 0.0 | ||
| 322. Fuels and lubricants, other | 951 | 0.2 | 3,595 | 0.4 | 3,205 | 0.5 | 3,303 | 0.5 | 14,683 | 2.2 |
| 4. Capital goods (except transport equipment), and parts and accessories thereof | 167,688 | 27.6 | 214,537 | 26.2 | 206,345 | 30.0 | 221,148 | 32.1 | 219,993 | 32.2 |
| 41. Capital goods (except transport equipment) | 103,388 | 17.0 | 140,737 | 17.2 | 134,485 | 19.6 | 151,126 | 22.0 | 135,514 | 19.9 |
| 42. Capital goods (except transport equipment), parts and accessories | 64,299 | 10.6 | 73,801 | 9.0 | 71,860 | 10.5 | 70,021 | 10.2 | 84,478 | 12.4 |
| 5. Transport equipment and parts and accessories thereof | 20,567 | 3.4 | 59,199 | 7.2 | 25,984 | 3.8 | 20,183 | 2.9 | 16,330 | 2.4 |
| 51. Passenger motor vehicles | 4,232 | 0.7 | 34,463 | 4.2 | 12,984 | 1.9 | 5,032 | 0.7 | 295 | 0.0 |
| 52. Transport equipment, other than passenger motor vehicles | 1,818 | 0.3 | 8,648 | 1.1 | 1,770 | 0.3 | 1,496 | 0.2 | 4,426 | 0.6 |
| 521. Transport equipment, other than passenger motor vehicles, industrial | 855 | 0.1 | 7,000 | 0.9 | 1,289 | 0.2 | 1,271 | 0.2 | 4,263 | 0.6 |
| 522. Transport equipment, other than passenger motor vehicles, non-industrial | 963 | 0.2 | 1,647 | 0.2 | 480 | 0.1 | 225 | 0.0 | 163 | 0.0 |
| 53. Transport equipment, parts and accessories | 14,517 | 2.4 | 16,089 | 2.0 | 11,231 | 1.6 | 13,655 | 2.0 | 11,610 | 1.7 |
| 6. Consumer goods not elsewhere specified | 147,682 | 24.3 | 155,478 | 19.0 | 152,541 | 22.2 | 158,626 | 23.0 | 150,716 | 22.1 |
| 61. Consumer goods not elsewhere specified, durable | 30,021 | 4.9 | 42,648 | 5.2 | 40,698 | 5.9 | 39,649 | 5.8 | 40,768 | 6.0 |
| 62. Consumer goods not elsewhere specified, semi-durable | 15,337 | 2.5 | 10,749 | 1.3 | 11,384 | 1.7 | 9,733 | 1.4 | 10,165 | 1.5 |
| 63. Consumer goods not elsewhere specified, non-durable | 102,324 | 16.8 | 102,082 | 12.5 | 100,458 | 14.6 | 109,244 | 15.9 | 99,783 | 14.6 |
| 7. Goods not elsewhere specified | 6,474 | 1.1 | 6,463 | 0.8 | 3,920 | 0.6 | 3,547 | 0.5 | 8,853 | 1.3 |
| All groups | 608,256 | 100.0 | 818,584 | 100.0 | 687,129 | 100.0 | 688,407 | 100.0 | 682,411 | 100.0 |
| Classification | Description | Year level | Quarter level | Month level | |
|---|---|---|---|---|---|
| SITC | Standard International Trade Classification (classification system is maintained by the United Nations) | ███ | ███ | ███ | |
| BEC | The standard of statistical classification of BEC (Broad Economic Categories) is upheld by the UN and it is based on SITC-nomenclature. | ███ | ███ | ███ | |
| NACE | National industrial classification based on Statistical Classification of Economic Activities in the European Community Nomenclature générale des Activités économiques dans les Communautés européennes | ███ | ███ | ███ | |
| CPA | CPA = Classification of Products by Activities | ███ | ███ | ███ | |
| CN | The Combined Nomenclature is the common nomenclature of the European Community. | ███ | ███ | ███ |