
| Export of goods from Finland and import to Finland | BEC (Broad Economic Categories) |
*) The standard of statistical classification of BEC (Broad Economic Categories) is upheld by the UN and it is based on SITC-nomenclature.
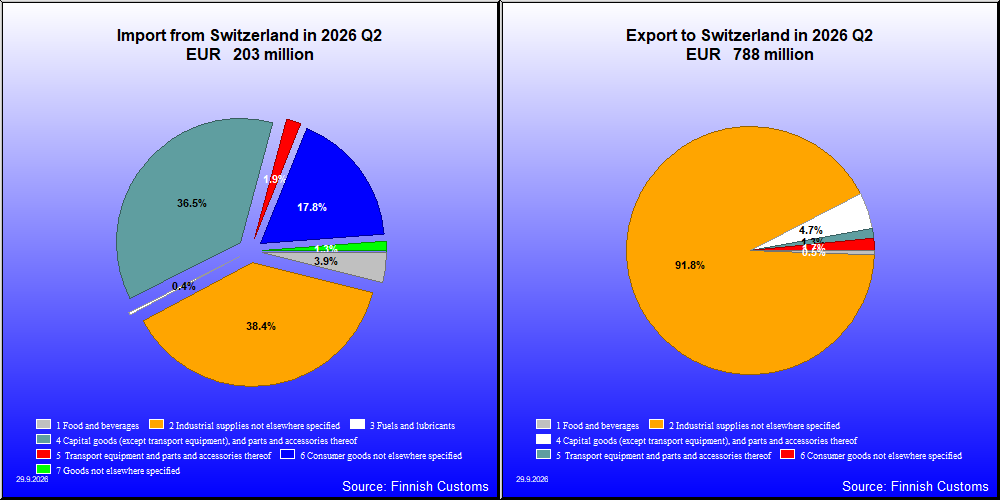
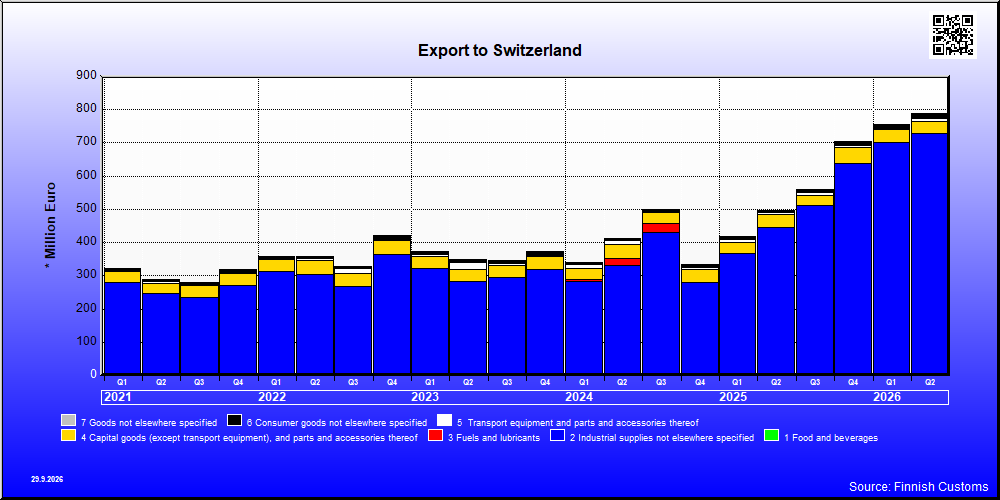
| Q2 / 2026 | Q2 / 2025 | Muutos edellisestä vastaavasta kaudesta % | ||
|---|---|---|---|---|
| 1,000 € | % | 1,000 € | ||
| 1. Food and beverages | 4,175 | 0.5 | 3,558 | 17.4 |
| 11. Food and beverages, primary | 37 | 0.0 | 32 | 13.8 |
| 111. Food and beverages, primary, mainly for industry | 1 | 0.0 | 0 | 158.5 |
| 112. Food and beverages, primary, mainly for household consumption | 36 | 0.0 | 32 | 12.5 |
| 12. Food and beverages, processed | 4,138 | 0.5 | 3,525 | 17.4 |
| 121. Food and beverages, processed, mainly for industry | 120 | 0.0 | 148 | -18.8 |
| 122. Food and beverages, processed, mainly for household consumption | 4,018 | 0.5 | 3,377 | 19.0 |
| 2. Industrial supplies not elsewhere specified | 723,882 | 91.8 | 441,892 | 63.8 |
| 21. Industrial supplies not elsewhere specified, primary | 245,166 | 31.1 | 163,583 | 49.9 |
| 22. Industrial supplies not elsewhere specified, processed | 478,716 | 60.7 | 278,309 | 72.0 |
| 3. Fuels and lubricants | 18 | 0.0 | 12 | 48.2 |
| 31. Fuels and lubricants, primary | 8 | 0.0 | 0 | .. |
| 32. Fuels and lubricants, processed | 10 | 0.0 | 12 | -20.3 |
| 322. Fuels and lubricants, other | 10 | 0.0 | 12 | -20.3 |
| 4. Capital goods (except transport equipment), and parts and accessories thereof | 36,707 | 4.7 | 40,443 | -9.2 |
| 41. Capital goods (except transport equipment) | 28,224 | 3.6 | 33,272 | -15.2 |
| 42. Capital goods (except transport equipment), parts and accessories | 8,482 | 1.1 | 7,171 | 18.3 |
| 5. Transport equipment and parts and accessories thereof | 10,418 | 1.3 | 3,798 | 174.3 |
| 51. Passenger motor vehicles | 485 | 0.1 | 0 | .. |
| 52. Transport equipment, other than passenger motor vehicles | 8,269 | 1.0 | 1,172 | 605.2 |
| 521. Transport equipment, other than passenger motor vehicles, industrial | 2,736 | 0.3 | 544 | 402.9 |
| 522. Transport equipment, other than passenger motor vehicles, non-industrial | 5,533 | 0.7 | 628 | 780.5 |
| 53. Transport equipment, parts and accessories | 1,663 | 0.2 | 2,625 | -36.6 |
| 6. Consumer goods not elsewhere specified | 13,185 | 1.7 | 7,307 | 80.5 |
| 61. Consumer goods not elsewhere specified, durable | 1,362 | 0.2 | 1,482 | -8.1 |
| 62. Consumer goods not elsewhere specified, semi-durable | 4,018 | 0.5 | 3,910 | 2.8 |
| 63. Consumer goods not elsewhere specified, non-durable | 7,806 | 1.0 | 1,915 | 307.6 |
| 7. Goods not elsewhere specified | 418 | 0.1 | 124 | 236.4 |
| All groups | 788,804 | 100.0 | 497,133 | 58.7 |

| Q2 / 2026 | Q2 / 2025 | Muutos edellisestä vastaavasta kaudesta % | ||
|---|---|---|---|---|
| 1,000 € | % | 1,000 € | ||
| 1. Food and beverages | 7,724 | 3.8 | 9,952 | -22.4 |
| 11. Food and beverages, primary | 26 | 0.0 | 7 | 266.9 |
| 111. Food and beverages, primary, mainly for industry | 0 | 0.0 | 0 | -92.6 |
| 112. Food and beverages, primary, mainly for household consumption | 26 | 0.0 | 7 | 276.9 |
| 12. Food and beverages, processed | 7,698 | 3.8 | 9,945 | -22.6 |
| 121. Food and beverages, processed, mainly for industry | 451 | 0.2 | 3,380 | -86.7 |
| 122. Food and beverages, processed, mainly for household consumption | 7,247 | 3.6 | 6,565 | 10.4 |
| 2. Industrial supplies not elsewhere specified | 79,345 | 39.0 | 54,683 | 45.1 |
| 21. Industrial supplies not elsewhere specified, primary | 283 | 0.1 | 90 | 214.2 |
| 22. Industrial supplies not elsewhere specified, processed | 79,062 | 38.9 | 54,592 | 44.8 |
| 3. Fuels and lubricants | 735 | 0.4 | 848 | -13.4 |
| 32. Fuels and lubricants, processed | 735 | 0.4 | 848 | -13.4 |
| 322. Fuels and lubricants, other | 735 | 0.4 | 848 | -13.4 |
| 4. Capital goods (except transport equipment), and parts and accessories thereof | 73,567 | 36.2 | 52,622 | 39.8 |
| 41. Capital goods (except transport equipment) | 50,821 | 25.0 | 34,130 | 48.9 |
| 42. Capital goods (except transport equipment), parts and accessories | 22,746 | 11.2 | 18,491 | 23.0 |
| 5. Transport equipment and parts and accessories thereof | 3,902 | 1.9 | 6,861 | -43.1 |
| 51. Passenger motor vehicles | 37 | 0.0 | 153 | -76.0 |
| 52. Transport equipment, other than passenger motor vehicles | 186 | 0.1 | 4,021 | -95.4 |
| 521. Transport equipment, other than passenger motor vehicles, industrial | 60 | 0.0 | 3,984 | -98.5 |
| 522. Transport equipment, other than passenger motor vehicles, non-industrial | 126 | 0.1 | 36 | 246.6 |
| 53. Transport equipment, parts and accessories | 3,680 | 1.8 | 2,687 | 36.9 |
| 6. Consumer goods not elsewhere specified | 35,671 | 17.5 | 42,243 | -15.6 |
| 61. Consumer goods not elsewhere specified, durable | 10,723 | 5.3 | 10,487 | 2.3 |
| 62. Consumer goods not elsewhere specified, semi-durable | 1,877 | 0.9 | 3,105 | -39.6 |
| 63. Consumer goods not elsewhere specified, non-durable | 23,071 | 11.3 | 28,651 | -19.5 |
| 7. Goods not elsewhere specified | 2,557 | 1.3 | 2,088 | 22.4 |
| All groups | 203,500 | 100.0 | 169,296 | 20.2 |
| Classification | Description | Year level | Quarter level | Month level | Year 2026 sofar |
|---|---|---|---|---|---|
| SITC | Standard International Trade Classification (classification system is maintained by the United Nations) | ███ | ███ | ███ | ███ |
| BEC | The standard of statistical classification of BEC (Broad Economic Categories) is upheld by the UN and it is based on SITC-nomenclature. | ███ | ███ | ███ | ███ |
| NACE | National industrial classification based on Statistical Classification of Economic Activities in the European Community Nomenclature générale des Activités économiques dans les Communautés européennes | ███ | ███ | ███ | ███ |
| CPA | CPA = Classification of Products by Activities | ███ | ███ | ███ | ███ |
| CN | The Combined Nomenclature is the common nomenclature of the European Community. | ███ | ███ | ███ | ███ |