
| Export of goods from Finland and import to Finland | BEC (Broad Economic Categories) |
*) The standard of statistical classification of BEC (Broad Economic Categories) is upheld by the UN and it is based on SITC-nomenclature.
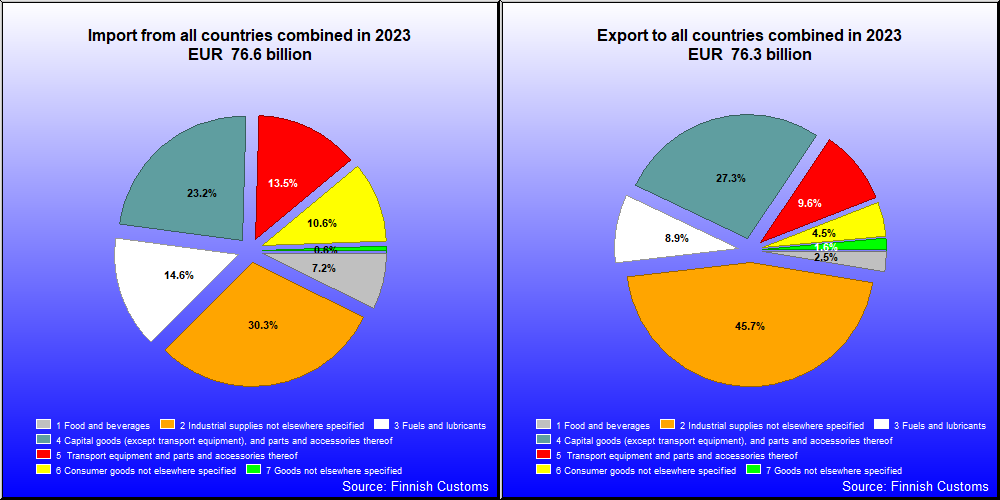
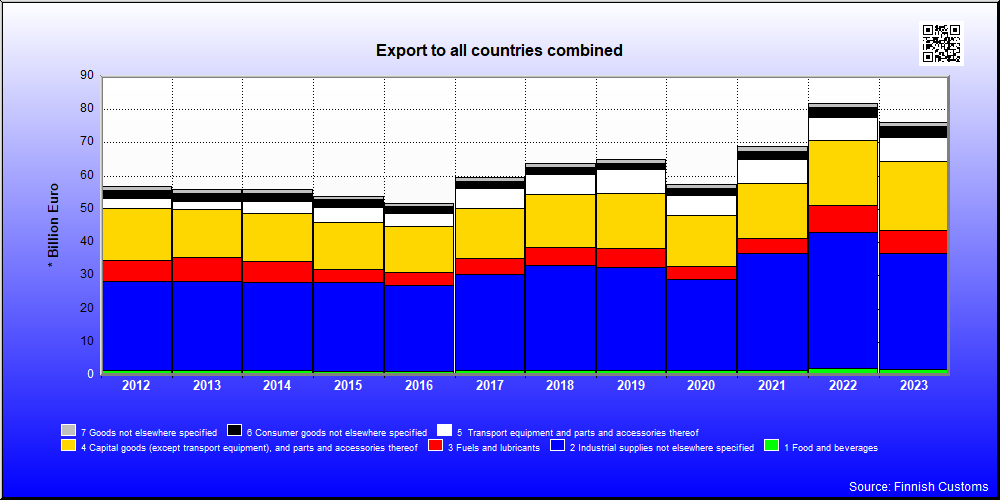
| 2021 | 2022 | 2023 | 2024 | 2025 | ||||||
|---|---|---|---|---|---|---|---|---|---|---|
| 1,000 € | % | 1,000 € | % | 1,000 € | % | 1,000 € | % | 1,000 € | % | |
| 1. Food and beverages | 1,559,733 | 2.3 | 1,959,534 | 2.4 | 1,911,023 | 2.5 | 1,980,315 | 2.7 | 2,142,113 | 3.1 |
| 11. Food and beverages, primary | 308,467 | 0.4 | 463,533 | 0.6 | 413,032 | 0.5 | 392,370 | 0.5 | 433,486 | 0.6 |
| 111. Food and beverages, primary, mainly for industry | 39,131 | 0.1 | 49,820 | 0.1 | 38,710 | 0.1 | 30,214 | 0.0 | 27,495 | 0.0 |
| 112. Food and beverages, primary, mainly for household consumption | 269,336 | 0.4 | 413,713 | 0.5 | 374,322 | 0.5 | 362,157 | 0.5 | 405,990 | 0.6 |
| 12. Food and beverages, processed | 1,251,266 | 1.8 | 1,496,001 | 1.8 | 1,497,991 | 2.0 | 1,587,945 | 2.2 | 1,708,628 | 2.5 |
| 121. Food and beverages, processed, mainly for industry | 279,221 | 0.4 | 351,838 | 0.4 | 298,297 | 0.4 | 297,420 | 0.4 | 326,067 | 0.5 |
| 122. Food and beverages, processed, mainly for household consumption | 972,045 | 1.4 | 1,144,163 | 1.4 | 1,199,695 | 1.6 | 1,290,524 | 1.8 | 1,382,560 | 2.0 |
| 2. Industrial supplies not elsewhere specified | 35,139,221 | 51.0 | 41,214,351 | 50.4 | 34,881,452 | 45.7 | 34,368,372 | 47.7 | 34,624,661 | 50.7 |
| 21. Industrial supplies not elsewhere specified, primary | 2,231,255 | 3.2 | 2,290,712 | 2.8 | 2,070,163 | 2.7 | 2,624,255 | 3.6 | 3,065,390 | 4.5 |
| 22. Industrial supplies not elsewhere specified, processed | 32,907,965 | 47.8 | 38,923,639 | 47.6 | 32,811,290 | 43.0 | 31,744,118 | 44.0 | 31,559,271 | 46.2 |
| 3. Fuels and lubricants | 4,602,960 | 6.7 | 7,980,545 | 9.8 | 6,755,577 | 8.9 | 5,033,805 | 7.0 | 5,814,368 | 8.5 |
| 31. Fuels and lubricants, primary | 39,088 | 0.1 | 128,462 | 0.2 | 265,128 | 0.3 | 299,286 | 0.4 | 206,972 | 0.3 |
| 32. Fuels and lubricants, processed | 4,563,872 | 6.6 | 7,852,083 | 9.6 | 6,490,449 | 8.5 | 4,734,519 | 6.6 | 5,607,396 | 8.2 |
| 321. Fuels and lubricants, motor spirit | 3,844,535 | 5.6 | 3,544,082 | 4.3 | 2,692,888 | 3.5 | 2,068,387 | 2.9 | 2,142,120 | 3.1 |
| 322. Fuels and lubricants, other | 719,338 | 1.0 | 4,308,001 | 5.3 | 3,797,561 | 5.0 | 2,666,133 | 3.7 | 3,465,276 | 5.1 |
| 4. Capital goods (except transport equipment), and parts and accessories thereof | 16,552,716 | 24.0 | 19,527,227 | 23.9 | 20,793,965 | 27.3 | 19,558,134 | 27.1 | 19,881,998 | 29.1 |
| 41. Capital goods (except transport equipment) | 11,559,776 | 16.8 | 14,451,090 | 17.7 | 15,158,585 | 19.9 | 14,003,921 | 19.4 | 14,066,197 | 20.6 |
| 42. Capital goods (except transport equipment), parts and accessories | 4,992,940 | 7.2 | 5,076,137 | 6.2 | 5,635,380 | 7.4 | 5,554,213 | 7.7 | 5,815,802 | 8.5 |
| 5. Transport equipment and parts and accessories thereof | 7,287,151 | 10.6 | 7,043,566 | 8.6 | 7,306,153 | 9.6 | 6,298,605 | 8.7 | 7,122,554 | 10.4 |
| 51. Passenger motor vehicles | 2,671,203 | 3.9 | 2,024,141 | 2.5 | 991,178 | 1.3 | 912,242 | 1.3 | 1,090,619 | 1.6 |
| 52. Transport equipment, other than passenger motor vehicles | 3,036,118 | 4.4 | 3,203,231 | 3.9 | 4,029,488 | 5.3 | 3,062,783 | 4.2 | 3,931,814 | 5.8 |
| 521. Transport equipment, other than passenger motor vehicles, industrial | 2,460,286 | 3.6 | 2,571,260 | 3.1 | 3,467,817 | 4.5 | 2,595,913 | 3.6 | 3,511,260 | 5.1 |
| 522. Transport equipment, other than passenger motor vehicles, non-industrial | 575,832 | 0.8 | 631,971 | 0.8 | 561,671 | 0.7 | 466,870 | 0.6 | 420,554 | 0.6 |
| 53. Transport equipment, parts and accessories | 1,579,829 | 2.3 | 1,816,195 | 2.2 | 2,285,487 | 3.0 | 2,323,580 | 3.2 | 2,100,120 | 3.1 |
| 6. Consumer goods not elsewhere specified | 2,374,643 | 3.4 | 2,883,438 | 3.5 | 3,424,632 | 4.5 | 3,779,948 | 5.2 | 3,811,300 | 5.6 |
| 61. Consumer goods not elsewhere specified, durable | 353,212 | 0.5 | 365,243 | 0.4 | 365,296 | 0.5 | 350,515 | 0.5 | 403,856 | 0.6 |
| 62. Consumer goods not elsewhere specified, semi-durable | 852,784 | 1.2 | 1,089,340 | 1.3 | 1,064,422 | 1.4 | 1,019,495 | 1.4 | 1,140,180 | 1.7 |
| 63. Consumer goods not elsewhere specified, non-durable | 1,168,647 | 1.7 | 1,428,855 | 1.7 | 1,994,914 | 2.6 | 2,409,938 | 3.3 | 2,267,263 | 3.3 |
| 7. Goods not elsewhere specified | 1,367,723 | 2.0 | 1,213,855 | 1.5 | 1,199,393 | 1.6 | 1,076,017 | 1.5 | 935,868 | 1.4 |
| All groups | 68,884,146 | 100.0 | 81,822,516 | 100.0 | 76,272,195 | 100.0 | 72,095,197 | 100.0 | 68,273,620 | 100.0 |

| 2021 | 2022 | 2023 | 2024 | 2025 | ||||||
|---|---|---|---|---|---|---|---|---|---|---|
| 1,000 € | % | 1,000 € | % | 1,000 € | % | 1,000 € | % | 1,000 € | % | |
| 1. Food and beverages | 4,402,359 | 6.1 | 5,339,267 | 5.8 | 5,514,720 | 7.2 | 5,731,088 | 7.7 | 6,091,948 | 8.9 |
| 11. Food and beverages, primary | 1,427,651 | 2.0 | 1,726,493 | 1.9 | 1,520,883 | 2.0 | 1,595,301 | 2.1 | 1,750,264 | 2.5 |
| 111. Food and beverages, primary, mainly for industry | 286,477 | 0.4 | 473,392 | 0.5 | 325,745 | 0.4 | 361,946 | 0.5 | 435,388 | 0.6 |
| 112. Food and beverages, primary, mainly for household consumption | 1,141,173 | 1.6 | 1,253,100 | 1.4 | 1,195,138 | 1.6 | 1,233,355 | 1.7 | 1,314,875 | 1.9 |
| 12. Food and beverages, processed | 2,974,708 | 4.1 | 3,612,775 | 3.9 | 3,993,836 | 5.2 | 4,135,787 | 5.6 | 4,341,684 | 6.3 |
| 121. Food and beverages, processed, mainly for industry | 167,930 | 0.2 | 248,037 | 0.3 | 272,678 | 0.4 | 325,325 | 0.4 | 363,935 | 0.5 |
| 122. Food and beverages, processed, mainly for household consumption | 2,806,778 | 3.9 | 3,364,738 | 3.6 | 3,721,159 | 4.9 | 3,810,462 | 5.1 | 3,977,749 | 5.8 |
| 2. Industrial supplies not elsewhere specified | 23,950,718 | 32.9 | 29,226,275 | 31.7 | 23,219,709 | 30.3 | 22,398,488 | 30.2 | 22,273,887 | 32.4 |
| 21. Industrial supplies not elsewhere specified, primary | 5,477,391 | 7.5 | 6,186,279 | 6.7 | 4,950,430 | 6.5 | 5,170,720 | 7.0 | 5,124,638 | 7.4 |
| 22. Industrial supplies not elsewhere specified, processed | 18,473,327 | 25.4 | 23,039,996 | 25.0 | 18,269,279 | 23.9 | 17,227,768 | 23.2 | 17,149,250 | 24.9 |
| 3. Fuels and lubricants | 9,508,312 | 13.1 | 18,095,895 | 19.6 | 11,178,776 | 14.6 | 10,150,964 | 13.7 | 9,456,038 | 13.7 |
| 31. Fuels and lubricants, primary | 4,842,951 | 6.7 | 9,620,334 | 10.4 | 6,586,694 | 8.6 | 5,490,877 | 7.4 | 5,451,466 | 7.9 |
| 32. Fuels and lubricants, processed | 4,665,361 | 6.4 | 8,475,561 | 9.2 | 4,592,082 | 6.0 | 4,660,087 | 6.3 | 4,004,572 | 5.8 |
| 321. Fuels and lubricants, motor spirit | 2,607,156 | 3.6 | 1,063,466 | 1.2 | 744,484 | 1.0 | 686,449 | 0.9 | 443,895 | 0.6 |
| 322. Fuels and lubricants, other | 2,058,205 | 2.8 | 7,412,095 | 8.0 | 3,847,599 | 5.0 | 3,973,638 | 5.3 | 3,560,677 | 5.2 |
| 4. Capital goods (except transport equipment), and parts and accessories thereof | 14,769,954 | 20.3 | 18,562,671 | 20.1 | 17,793,498 | 23.2 | 16,876,232 | 22.7 | 18,432,181 | 26.8 |
| 41. Capital goods (except transport equipment) | 9,318,267 | 12.8 | 12,032,293 | 13.0 | 11,654,168 | 15.2 | 10,970,208 | 14.8 | 12,292,727 | 17.9 |
| 42. Capital goods (except transport equipment), parts and accessories | 5,451,687 | 7.5 | 6,530,378 | 7.1 | 6,139,330 | 8.0 | 5,906,024 | 8.0 | 6,139,454 | 8.9 |
| 5. Transport equipment and parts and accessories thereof | 9,174,356 | 12.6 | 9,800,753 | 10.6 | 10,318,339 | 13.5 | 9,847,172 | 13.3 | 9,043,755 | 13.1 |
| 51. Passenger motor vehicles | 3,164,422 | 4.4 | 3,380,775 | 3.7 | 4,143,387 | 5.4 | 3,675,854 | 4.9 | 3,475,379 | 5.1 |
| 52. Transport equipment, other than passenger motor vehicles | 1,823,407 | 2.5 | 1,994,728 | 2.2 | 2,418,140 | 3.2 | 1,901,326 | 2.6 | 1,654,840 | 2.4 |
| 521. Transport equipment, other than passenger motor vehicles, industrial | 1,463,871 | 2.0 | 1,507,450 | 1.6 | 1,968,313 | 2.6 | 1,574,050 | 2.1 | 1,361,610 | 2.0 |
| 522. Transport equipment, other than passenger motor vehicles, non-industrial | 359,536 | 0.5 | 487,278 | 0.5 | 449,827 | 0.6 | 327,276 | 0.4 | 293,229 | 0.4 |
| 53. Transport equipment, parts and accessories | 4,186,527 | 5.8 | 4,425,250 | 4.8 | 3,756,812 | 4.9 | 4,269,992 | 5.7 | 3,913,537 | 5.7 |
| 6. Consumer goods not elsewhere specified | 7,360,546 | 10.1 | 8,497,354 | 9.2 | 8,080,779 | 10.6 | 8,076,981 | 10.9 | 8,415,063 | 12.2 |
| 61. Consumer goods not elsewhere specified, durable | 1,676,425 | 2.3 | 1,778,547 | 1.9 | 1,659,807 | 2.2 | 1,625,754 | 2.2 | 1,786,223 | 2.6 |
| 62. Consumer goods not elsewhere specified, semi-durable | 2,667,626 | 3.7 | 3,322,262 | 3.6 | 2,903,683 | 3.8 | 2,878,977 | 3.9 | 2,993,263 | 4.4 |
| 63. Consumer goods not elsewhere specified, non-durable | 3,016,495 | 4.1 | 3,396,546 | 3.7 | 3,517,288 | 4.6 | 3,572,249 | 4.8 | 3,635,577 | 5.3 |
| 7. Goods not elsewhere specified | 3,553,996 | 4.9 | 2,700,427 | 2.9 | 454,393 | 0.6 | 1,204,427 | 1.6 | 1,335,426 | 1.9 |
| All groups | 72,720,241 | 100.0 | 92,222,643 | 100.0 | 76,560,214 | 100.0 | 74,285,351 | 100.0 | 68,799,156 | 100.0 |
| Classification | Description | Year level | Quarter level | Month level | |
|---|---|---|---|---|---|
| SITC | Standard International Trade Classification (classification system is maintained by the United Nations) | ███ | ███ | ||
| BEC | The standard of statistical classification of BEC (Broad Economic Categories) is upheld by the UN and it is based on SITC-nomenclature. | ███ | ███ | ||
| NACE | National industrial classification based on Statistical Classification of Economic Activities in the European Community Nomenclature générale des Activités économiques dans les Communautés européennes | ███ | ███ | ||
| CPA | CPA = Classification of Products by Activities | ███ | ███ | ||
| CN | The Combined Nomenclature is the common nomenclature of the European Community. | ███ | ███ |