
| Export of goods from Finland and import to Finland | BEC (Broad Economic Categories) |
*) The standard of statistical classification of BEC (Broad Economic Categories) is upheld by the UN and it is based on SITC-nomenclature.
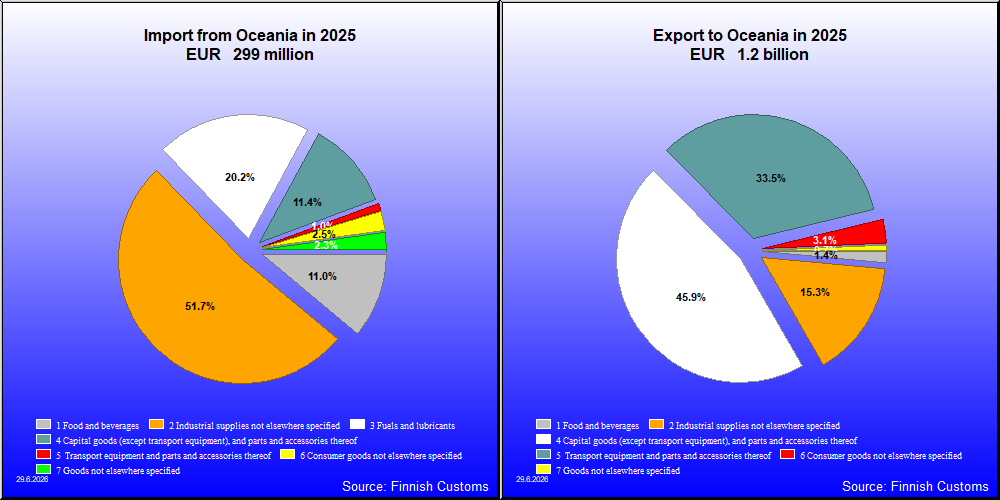

| 2021 | 2022 | 2023 | 2024 | 2025 | ||||||
|---|---|---|---|---|---|---|---|---|---|---|
| 1,000 € | % | 1,000 € | % | 1,000 € | % | 1,000 € | % | 1,000 € | % | |
| 1. Food and beverages | 14,697 | 1.9 | 25,264 | 2.7 | 18,330 | 2.0 | 20,725 | 1.9 | 16,843 | 1.4 |
| 11. Food and beverages, primary | 41 | 0.0 | 5 | 0.0 | 189 | 0.0 | 67 | 0.0 | 11 | 0.0 |
| 111. Food and beverages, primary, mainly for industry | 3 | 0.0 | 3 | 0.0 | 4 | 0.0 | 6 | 0.0 | 5 | 0.0 |
| 112. Food and beverages, primary, mainly for household consumption | 39 | 0.0 | 2 | 0.0 | 185 | 0.0 | 61 | 0.0 | 6 | 0.0 |
| 12. Food and beverages, processed | 14,656 | 1.9 | 25,259 | 2.7 | 18,142 | 2.0 | 20,658 | 1.9 | 16,832 | 1.4 |
| 121. Food and beverages, processed, mainly for industry | 779 | 0.1 | 1,365 | 0.1 | 410 | 0.0 | 431 | 0.0 | 308 | 0.0 |
| 122. Food and beverages, processed, mainly for household consumption | 13,877 | 1.8 | 23,893 | 2.6 | 17,732 | 2.0 | 20,228 | 1.8 | 16,524 | 1.4 |
| 2. Industrial supplies not elsewhere specified | 184,495 | 24.0 | 254,277 | 27.3 | 199,610 | 22.2 | 174,954 | 15.9 | 181,402 | 15.3 |
| 21. Industrial supplies not elsewhere specified, primary | 5,493 | 0.7 | 8,023 | 0.9 | 23,430 | 2.6 | 2,395 | 0.2 | 2,954 | 0.2 |
| 22. Industrial supplies not elsewhere specified, processed | 179,001 | 23.3 | 246,254 | 26.4 | 176,180 | 19.6 | 172,558 | 15.7 | 178,448 | 15.0 |
| 3. Fuels and lubricants | 144 | 0.0 | 281 | 0.0 | 230 | 0.0 | 321 | 0.0 | 491 | 0.0 |
| 31. Fuels and lubricants, primary | 17 | 0.0 | 88 | 0.0 | 31 | 0.0 | 14 | 0.0 | 266 | 0.0 |
| 32. Fuels and lubricants, processed | 127 | 0.0 | 193 | 0.0 | 199 | 0.0 | 307 | 0.0 | 225 | 0.0 |
| 321. Fuels and lubricants, motor spirit | 117 | 0.0 | 1 | 0.0 | ||||||
| 322. Fuels and lubricants, other | 11 | 0.0 | 193 | 0.0 | 199 | 0.0 | 307 | 0.0 | 225 | 0.0 |
| 4. Capital goods (except transport equipment), and parts and accessories thereof | 451,701 | 58.8 | 502,126 | 53.8 | 503,750 | 56.1 | 448,509 | 40.7 | 545,499 | 45.9 |
| 41. Capital goods (except transport equipment) | 373,710 | 48.6 | 421,144 | 45.2 | 408,496 | 45.5 | 357,248 | 32.5 | 456,824 | 38.5 |
| 42. Capital goods (except transport equipment), parts and accessories | 77,991 | 10.2 | 80,982 | 8.7 | 95,277 | 10.6 | 91,260 | 8.3 | 88,678 | 7.5 |
| 5. Transport equipment and parts and accessories thereof | 78,837 | 10.3 | 111,928 | 12.0 | 119,906 | 13.4 | 406,733 | 36.9 | 397,988 | 33.5 |
| 51. Passenger motor vehicles | 160 | 0.0 | 589 | 0.1 | 47 | 0.0 | 818 | 0.1 | 308 | 0.0 |
| 52. Transport equipment, other than passenger motor vehicles | 71,250 | 9.3 | 105,487 | 11.3 | 112,066 | 12.5 | 391,382 | 35.6 | 389,586 | 32.8 |
| 521. Transport equipment, other than passenger motor vehicles, industrial | 68,358 | 8.9 | 103,424 | 11.1 | 106,873 | 11.9 | 389,253 | 35.4 | 385,165 | 32.4 |
| 522. Transport equipment, other than passenger motor vehicles, non-industrial | 2,892 | 0.4 | 2,064 | 0.2 | 5,193 | 0.6 | 2,129 | 0.2 | 4,421 | 0.4 |
| 53. Transport equipment, parts and accessories | 7,427 | 1.0 | 5,852 | 0.6 | 7,794 | 0.9 | 14,533 | 1.3 | 8,196 | 0.7 |
| 6. Consumer goods not elsewhere specified | 34,846 | 4.5 | 37,171 | 4.0 | 39,937 | 4.4 | 47,900 | 4.4 | 37,321 | 3.1 |
| 61. Consumer goods not elsewhere specified, durable | 9,812 | 1.3 | 10,489 | 1.1 | 8,913 | 1.0 | 7,389 | 0.7 | 11,646 | 1.0 |
| 62. Consumer goods not elsewhere specified, semi-durable | 9,129 | 1.2 | 10,551 | 1.1 | 9,379 | 1.0 | 9,649 | 0.9 | 9,796 | 0.8 |
| 63. Consumer goods not elsewhere specified, non-durable | 15,905 | 2.1 | 16,131 | 1.7 | 21,645 | 2.4 | 30,861 | 2.8 | 15,879 | 1.3 |
| 7. Goods not elsewhere specified | 3,645 | 0.5 | 1,493 | 0.2 | 16,151 | 1.8 | 1,738 | 0.2 | 8,368 | 0.7 |
| All groups | 768,365 | 100.0 | 932,541 | 100.0 | 897,915 | 100.0 | 1,100,879 | 100.0 | 1,187,908 | 100.0 |

| 2021 | 2022 | 2023 | 2024 | 2025 | ||||||
|---|---|---|---|---|---|---|---|---|---|---|
| 1,000 € | % | 1,000 € | % | 1,000 € | % | 1,000 € | % | 1,000 € | % | |
| 1. Food and beverages | 36,216 | 11.2 | 35,006 | 5.2 | 30,132 | 6.3 | 28,885 | 6.4 | 32,899 | 11.0 |
| 11. Food and beverages, primary | 4,732 | 1.5 | 2,750 | 0.4 | 1,907 | 0.4 | 3,819 | 0.9 | 4,393 | 1.5 |
| 111. Food and beverages, primary, mainly for industry | 248 | 0.1 | 339 | 0.1 | 138 | 0.0 | 189 | 0.0 | 142 | 0.0 |
| 112. Food and beverages, primary, mainly for household consumption | 4,484 | 1.4 | 2,410 | 0.4 | 1,770 | 0.4 | 3,645 | 0.8 | 4,250 | 1.4 |
| 12. Food and beverages, processed | 31,484 | 9.8 | 32,257 | 4.8 | 28,225 | 5.9 | 25,066 | 5.6 | 28,506 | 9.5 |
| 121. Food and beverages, processed, mainly for industry | 299 | 0.1 | 312 | 0.0 | 143 | 0.0 | 87 | 0.0 | 64 | 0.0 |
| 122. Food and beverages, processed, mainly for household consumption | 31,185 | 9.7 | 31,945 | 4.7 | 28,082 | 5.9 | 24,978 | 5.6 | 28,443 | 9.5 |
| 2. Industrial supplies not elsewhere specified | 234,330 | 72.7 | 323,871 | 48.1 | 286,064 | 60.2 | 243,921 | 54.4 | 154,632 | 51.7 |
| 21. Industrial supplies not elsewhere specified, primary | 163,167 | 50.6 | 264,704 | 39.3 | 217,626 | 45.8 | 184,640 | 41.2 | 102,941 | 34.4 |
| 22. Industrial supplies not elsewhere specified, processed | 71,163 | 22.1 | 59,167 | 8.8 | 68,438 | 14.4 | 59,281 | 13.2 | 51,691 | 17.3 |
| 3. Fuels and lubricants | 8,643 | 2.7 | 263,039 | 39.1 | 106,751 | 22.5 | 119,987 | 26.8 | 60,294 | 20.2 |
| 31. Fuels and lubricants, primary | 8,554 | 2.7 | 262,949 | 39.1 | 106,734 | 22.5 | 119,960 | 26.8 | 60,275 | 20.2 |
| 32. Fuels and lubricants, processed | 89 | 0.0 | 90 | 0.0 | 17 | 0.0 | 27 | 0.0 | 19 | 0.0 |
| 321. Fuels and lubricants, motor spirit | 13 | 0.0 | ||||||||
| 322. Fuels and lubricants, other | 76 | 0.0 | 90 | 0.0 | 17 | 0.0 | 27 | 0.0 | 19 | 0.0 |
| 4. Capital goods (except transport equipment), and parts and accessories thereof | 32,772 | 10.2 | 35,920 | 5.3 | 35,895 | 7.6 | 34,849 | 7.8 | 33,974 | 11.4 |
| 41. Capital goods (except transport equipment) | 20,917 | 6.5 | 25,143 | 3.7 | 27,200 | 5.7 | 27,234 | 6.1 | 25,278 | 8.5 |
| 42. Capital goods (except transport equipment), parts and accessories | 11,855 | 3.7 | 10,776 | 1.6 | 8,695 | 1.8 | 7,615 | 1.7 | 8,696 | 2.9 |
| 5. Transport equipment and parts and accessories thereof | 2,486 | 0.8 | 21,645 | 3.2 | 3,119 | 0.7 | 2,785 | 0.6 | 2,902 | 1.0 |
| 51. Passenger motor vehicles | 221 | 0.1 | 19,656 | 2.9 | 291 | 0.1 | 106 | 0.0 | 463 | 0.2 |
| 52. Transport equipment, other than passenger motor vehicles | 356 | 0.1 | 61 | 0.0 | 1,352 | 0.3 | 1,322 | 0.3 | 405 | 0.1 |
| 521. Transport equipment, other than passenger motor vehicles, industrial | 81 | 0.0 | 10 | 0.0 | 198 | 0.0 | 187 | 0.0 | 105 | 0.0 |
| 522. Transport equipment, other than passenger motor vehicles, non-industrial | 275 | 0.1 | 51 | 0.0 | 1,154 | 0.2 | 1,134 | 0.3 | 300 | 0.1 |
| 53. Transport equipment, parts and accessories | 1,908 | 0.6 | 1,929 | 0.3 | 1,476 | 0.3 | 1,358 | 0.3 | 2,033 | 0.7 |
| 6. Consumer goods not elsewhere specified | 6,825 | 2.1 | 5,750 | 0.9 | 6,295 | 1.3 | 6,776 | 1.5 | 7,445 | 2.5 |
| 61. Consumer goods not elsewhere specified, durable | 979 | 0.3 | 1,186 | 0.2 | 1,316 | 0.3 | 1,954 | 0.4 | 2,634 | 0.9 |
| 62. Consumer goods not elsewhere specified, semi-durable | 2,350 | 0.7 | 1,387 | 0.2 | 1,331 | 0.3 | 1,215 | 0.3 | 1,745 | 0.6 |
| 63. Consumer goods not elsewhere specified, non-durable | 3,496 | 1.1 | 3,176 | 0.5 | 3,649 | 0.8 | 3,607 | 0.8 | 3,066 | 1.0 |
| 7. Goods not elsewhere specified | 1,188 | 0.4 | 3,099 | 0.5 | 7,104 | 1.5 | 10,790 | 2.4 | 6,886 | 2.3 |
| All groups | 322,459 | 100.0 | 673,178 | 100.0 | 475,361 | 100.0 | 447,994 | 100.0 | 299,026 | 100.0 |
| Classification | Description | Year level | Quarter level | Month level | |
|---|---|---|---|---|---|
| SITC | Standard International Trade Classification (classification system is maintained by the United Nations) | ███ | ███ | ███ | |
| BEC | The standard of statistical classification of BEC (Broad Economic Categories) is upheld by the UN and it is based on SITC-nomenclature. | ███ | ███ | ███ | |
| NACE | National industrial classification based on Statistical Classification of Economic Activities in the European Community Nomenclature générale des Activités économiques dans les Communautés européennes | ███ | ███ | ███ | |
| CPA | CPA = Classification of Products by Activities | ███ | ███ | ███ | |
| CN | The Combined Nomenclature is the common nomenclature of the European Community. | ███ | ███ | ███ |