
| Export of goods from Finland and import to Finland | BEC (Broad Economic Categories) |
*) The standard of statistical classification of BEC (Broad Economic Categories) is upheld by the UN and it is based on SITC-nomenclature.

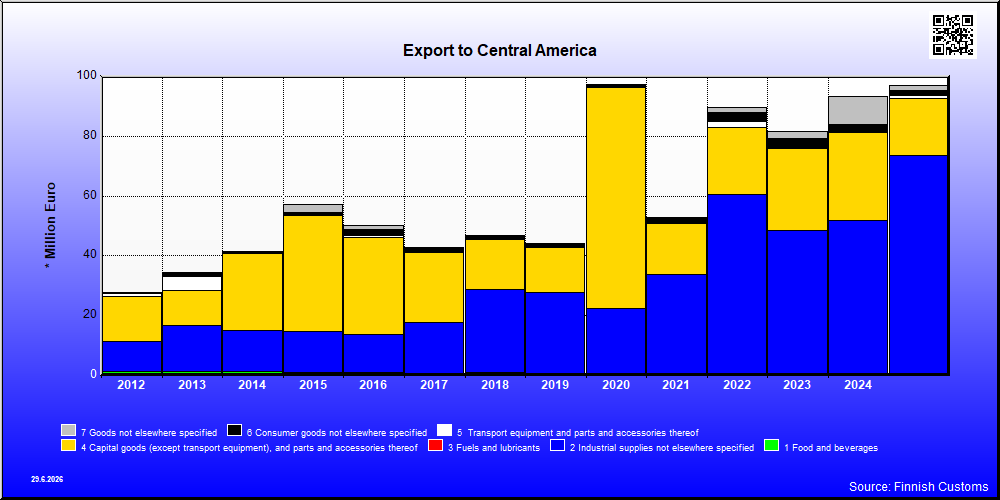
| 2021 | 2022 | 2023 | 2024 | 2025 | ||||||
|---|---|---|---|---|---|---|---|---|---|---|
| 1,000 € | % | 1,000 € | % | 1,000 € | % | 1,000 € | % | 1,000 € | % | |
| 1. Food and beverages | 482 | 0.9 | 505 | 0.6 | 501 | 0.6 | 611 | 0.7 | 676 | 0.7 |
| 12. Food and beverages, processed | 482 | 0.9 | 505 | 0.6 | 501 | 0.6 | 611 | 0.7 | 676 | 0.7 |
| 122. Food and beverages, processed, mainly for household consumption | 482 | 0.9 | 505 | 0.6 | 501 | 0.6 | 611 | 0.7 | 676 | 0.7 |
| 2. Industrial supplies not elsewhere specified | 33,266 | 63.1 | 60,047 | 67.0 | 47,912 | 58.6 | 51,272 | 55.0 | 72,852 | 75.0 |
| 21. Industrial supplies not elsewhere specified, primary | 35 | 0.1 | 1 | 0.0 | 334 | 0.3 | ||||
| 22. Industrial supplies not elsewhere specified, processed | 33,231 | 63.0 | 60,047 | 67.0 | 47,910 | 58.6 | 51,272 | 55.0 | 72,518 | 74.7 |
| 3. Fuels and lubricants | 17 | 0.0 | 50 | 0.1 | 23 | 0.0 | 49 | 0.1 | ||
| 31. Fuels and lubricants, primary | 13 | 0.0 | 9 | 0.0 | 17 | 0.0 | 31 | 0.0 | ||
| 32. Fuels and lubricants, processed | 5 | 0.0 | 41 | 0.1 | 6 | 0.0 | 18 | 0.0 | ||
| 322. Fuels and lubricants, other | 5 | 0.0 | 41 | 0.1 | 6 | 0.0 | 18 | 0.0 | ||
| 4. Capital goods (except transport equipment), and parts and accessories thereof | 17,127 | 32.5 | 22,461 | 25.1 | 27,519 | 33.7 | 29,266 | 31.4 | 19,129 | 19.7 |
| 41. Capital goods (except transport equipment) | 8,661 | 16.4 | 14,910 | 16.6 | 17,899 | 21.9 | 25,183 | 27.0 | 14,907 | 15.3 |
| 42. Capital goods (except transport equipment), parts and accessories | 8,466 | 16.1 | 7,551 | 8.4 | 9,620 | 11.8 | 4,084 | 4.4 | 4,222 | 4.3 |
| 5. Transport equipment and parts and accessories thereof | 14 | 0.0 | 1,838 | 2.1 | 103 | 0.1 | 59 | 0.1 | 899 | 0.9 |
| 52. Transport equipment, other than passenger motor vehicles | 4 | 0.0 | 1,003 | 1.1 | 77 | 0.1 | 884 | 0.9 | ||
| 521. Transport equipment, other than passenger motor vehicles, industrial | 4 | 0.0 | 1,003 | 1.1 | 77 | 0.1 | 5 | 0.0 | ||
| 522. Transport equipment, other than passenger motor vehicles, non-industrial | 879 | 0.9 | ||||||||
| 53. Transport equipment, parts and accessories | 10 | 0.0 | 834 | 0.9 | 26 | 0.0 | 59 | 0.1 | 15 | 0.0 |
| 6. Consumer goods not elsewhere specified | 1,620 | 3.1 | 2,943 | 3.3 | 3,314 | 4.1 | 2,762 | 3.0 | 1,703 | 1.8 |
| 61. Consumer goods not elsewhere specified, durable | 15 | 0.0 | 7 | 0.0 | 17 | 0.0 | 63 | 0.1 | 35 | 0.0 |
| 62. Consumer goods not elsewhere specified, semi-durable | 574 | 1.1 | 905 | 1.0 | 321 | 0.4 | 175 | 0.2 | 267 | 0.3 |
| 63. Consumer goods not elsewhere specified, non-durable | 1,031 | 2.0 | 2,031 | 2.3 | 2,976 | 3.6 | 2,525 | 2.7 | 1,401 | 1.4 |
| 7. Goods not elsewhere specified | 225 | 0.4 | 1,826 | 2.0 | 2,333 | 2.9 | 9,232 | 9.9 | 1,810 | 1.9 |
| All groups | 52,735 | 100.0 | 89,638 | 100.0 | 81,731 | 100.0 | 93,226 | 100.0 | 97,118 | 100.0 |

| 2021 | 2022 | 2023 | 2024 | 2025 | ||||||
|---|---|---|---|---|---|---|---|---|---|---|
| 1,000 € | % | 1,000 € | % | 1,000 € | % | 1,000 € | % | 1,000 € | % | |
| 1. Food and beverages | 98,724 | 69.2 | 110,154 | 71.0 | 93,811 | 88.5 | 59,480 | 83.7 | 90,528 | 88.7 |
| 11. Food and beverages, primary | 96,851 | 67.9 | 107,256 | 69.2 | 78,775 | 74.3 | 57,040 | 80.3 | 88,085 | 86.3 |
| 111. Food and beverages, primary, mainly for industry | 33,965 | 23.8 | 53,869 | 34.7 | 42,317 | 39.9 | 38,657 | 54.4 | 52,144 | 51.1 |
| 112. Food and beverages, primary, mainly for household consumption | 62,886 | 44.1 | 53,387 | 34.4 | 36,458 | 34.4 | 18,383 | 25.9 | 35,941 | 35.2 |
| 12. Food and beverages, processed | 1,873 | 1.3 | 2,898 | 1.9 | 15,036 | 14.2 | 2,440 | 3.4 | 2,444 | 2.4 |
| 121. Food and beverages, processed, mainly for industry | 16 | 0.0 | 11,754 | 11.1 | 27 | 0.0 | 10 | 0.0 | ||
| 122. Food and beverages, processed, mainly for household consumption | 1,856 | 1.3 | 2,898 | 1.9 | 3,282 | 3.1 | 2,413 | 3.4 | 2,435 | 2.4 |
| 2. Industrial supplies not elsewhere specified | 36,129 | 25.3 | 33,291 | 21.5 | 860 | 0.8 | 725 | 1.0 | 1,043 | 1.0 |
| 21. Industrial supplies not elsewhere specified, primary | 132 | 0.1 | 362 | 0.2 | 319 | 0.3 | 233 | 0.3 | 185 | 0.2 |
| 22. Industrial supplies not elsewhere specified, processed | 35,997 | 25.2 | 32,929 | 21.2 | 541 | 0.5 | 491 | 0.7 | 857 | 0.8 |
| 3. Fuels and lubricants | 1 | 0.0 | 1 | 0.0 | 1 | 0.0 | 1 | 0.0 | ||
| 31. Fuels and lubricants, primary | 1 | 0.0 | 1 | 0.0 | 1 | 0.0 | ||||
| 4. Capital goods (except transport equipment), and parts and accessories thereof | 3,820 | 2.7 | 8,277 | 5.3 | 7,747 | 7.3 | 7,423 | 10.4 | 6,521 | 6.4 |
| 41. Capital goods (except transport equipment) | 2,930 | 2.1 | 5,049 | 3.3 | 5,984 | 5.6 | 6,945 | 9.8 | 5,417 | 5.3 |
| 42. Capital goods (except transport equipment), parts and accessories | 890 | 0.6 | 3,228 | 2.1 | 1,762 | 1.7 | 477 | 0.7 | 1,104 | 1.1 |
| 5. Transport equipment and parts and accessories thereof | 8 | 0.0 | 310 | 0.2 | 174 | 0.2 | 15 | 0.0 | 46 | 0.0 |
| 51. Passenger motor vehicles | 298 | 0.2 | 58 | 0.1 | ||||||
| 52. Transport equipment, other than passenger motor vehicles | 2 | 0.0 | 12 | 0.0 | ||||||
| 521. Transport equipment, other than passenger motor vehicles, industrial | 12 | 0.0 | ||||||||
| 522. Transport equipment, other than passenger motor vehicles, non-industrial | 2 | 0.0 | ||||||||
| 53. Transport equipment, parts and accessories | 8 | 0.0 | 12 | 0.0 | 114 | 0.1 | 15 | 0.0 | 34 | 0.0 |
| 6. Consumer goods not elsewhere specified | 2,455 | 1.7 | 2,890 | 1.9 | 3,387 | 3.2 | 3,402 | 4.8 | 3,930 | 3.9 |
| 61. Consumer goods not elsewhere specified, durable | 384 | 0.3 | 932 | 0.6 | 1,318 | 1.2 | 1,243 | 1.7 | 1,350 | 1.3 |
| 62. Consumer goods not elsewhere specified, semi-durable | 1,083 | 0.8 | 1,030 | 0.7 | 1,168 | 1.1 | 1,292 | 1.8 | 1,720 | 1.7 |
| 63. Consumer goods not elsewhere specified, non-durable | 989 | 0.7 | 927 | 0.6 | 901 | 0.8 | 867 | 1.2 | 860 | 0.8 |
| 7. Goods not elsewhere specified | 1,555 | 1.1 | 146 | 0.1 | 9 | 0.0 | 5 | 0.0 | 7 | 0.0 |
| All groups | 142,635 | 100.0 | 155,042 | 100.0 | 105,988 | 100.0 | 71,047 | 100.0 | 102,074 | 100.0 |
| Classification | Description | Year level | Quarter level | Month level | |
|---|---|---|---|---|---|
| SITC | Standard International Trade Classification (classification system is maintained by the United Nations) | ███ | ███ | ███ | |
| BEC | The standard of statistical classification of BEC (Broad Economic Categories) is upheld by the UN and it is based on SITC-nomenclature. | ███ | ███ | ███ | |
| NACE | National industrial classification based on Statistical Classification of Economic Activities in the European Community Nomenclature générale des Activités économiques dans les Communautés européennes | ███ | ███ | ███ | |
| CPA | CPA = Classification of Products by Activities | ███ | ███ | ███ | |
| CN | The Combined Nomenclature is the common nomenclature of the European Community. | ███ | ███ | ███ |