
| Export of goods from Finland and import to Finland | BEC (Broad Economic Categories) |
*) The standard of statistical classification of BEC (Broad Economic Categories) is upheld by the UN and it is based on SITC-nomenclature.
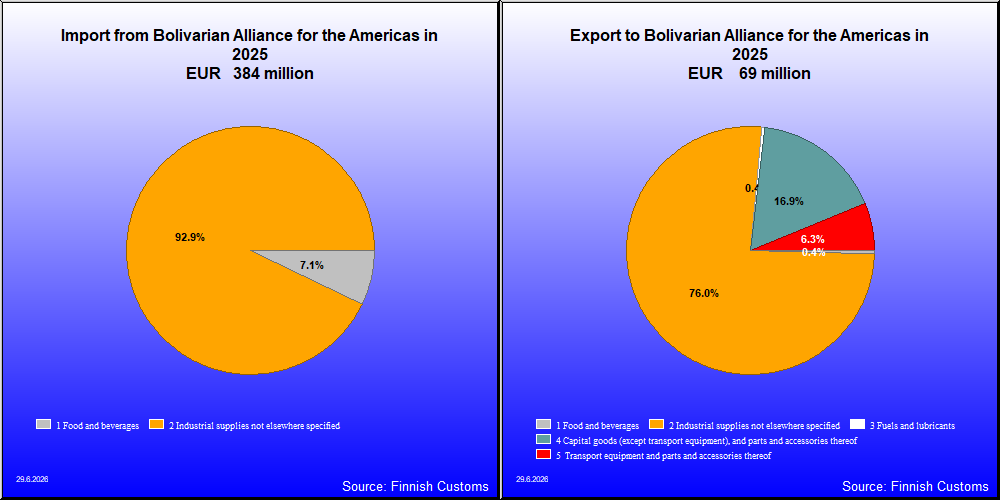
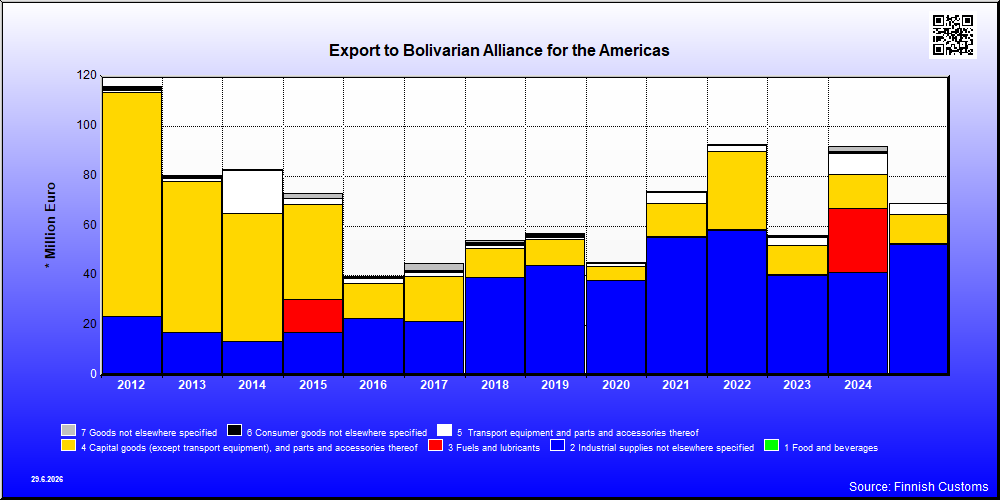
| 2021 | 2022 | 2023 | 2024 | 2025 | ||||||
|---|---|---|---|---|---|---|---|---|---|---|
| 1,000 € | % | 1,000 € | % | 1,000 € | % | 1,000 € | % | 1,000 € | % | |
| 1. Food and beverages | 303 | 0.4 | 323 | 0.3 | 221 | 0.4 | 231 | 0.3 | 306 | 0.4 |
| 12. Food and beverages, processed | 303 | 0.4 | 323 | 0.3 | 221 | 0.4 | 231 | 0.3 | 306 | 0.4 |
| 121. Food and beverages, processed, mainly for industry | 49 | 0.1 | 84 | 0.1 | 66 | 0.1 | 40 | 0.0 | 43 | 0.1 |
| 122. Food and beverages, processed, mainly for household consumption | 254 | 0.3 | 238 | 0.3 | 155 | 0.3 | 191 | 0.2 | 262 | 0.4 |
| 2. Industrial supplies not elsewhere specified | 55,127 | 74.5 | 57,940 | 62.5 | 40,026 | 71.2 | 41,127 | 44.7 | 52,415 | 75.8 |
| 21. Industrial supplies not elsewhere specified, primary | 3 | 0.0 | ||||||||
| 22. Industrial supplies not elsewhere specified, processed | 55,124 | 74.5 | 57,940 | 62.5 | 40,026 | 71.2 | 41,127 | 44.7 | 52,415 | 75.8 |
| 3. Fuels and lubricants | 183 | 0.2 | 169 | 0.2 | 138 | 0.2 | 25,675 | 27.9 | 246 | 0.4 |
| 31. Fuels and lubricants, primary | 183 | 0.2 | 169 | 0.2 | 134 | 0.2 | 43 | 0.0 | 246 | 0.4 |
| 32. Fuels and lubricants, processed | 3 | 0.0 | 25,632 | 27.9 | ||||||
| 321. Fuels and lubricants, motor spirit | 25,632 | 27.9 | ||||||||
| 322. Fuels and lubricants, other | 3 | 0.0 | ||||||||
| 4. Capital goods (except transport equipment), and parts and accessories thereof | 13,414 | 18.1 | 31,415 | 33.9 | 11,794 | 21.0 | 13,745 | 14.9 | 11,679 | 16.9 |
| 41. Capital goods (except transport equipment) | 8,157 | 11.0 | 25,514 | 27.5 | 5,138 | 9.1 | 10,541 | 11.5 | 6,439 | 9.3 |
| 42. Capital goods (except transport equipment), parts and accessories | 5,257 | 7.1 | 5,901 | 6.4 | 6,656 | 11.8 | 3,203 | 3.5 | 5,240 | 7.6 |
| 5. Transport equipment and parts and accessories thereof | 4,277 | 5.8 | 2,371 | 2.6 | 3,319 | 5.9 | 8,222 | 8.9 | 4,348 | 6.3 |
| 52. Transport equipment, other than passenger motor vehicles | 3,219 | 4.4 | 649 | 0.7 | 1,006 | 1.8 | 6,718 | 7.3 | 3,111 | 4.5 |
| 521. Transport equipment, other than passenger motor vehicles, industrial | 1,213 | 1.6 | 649 | 0.7 | 1,006 | 1.8 | 6,712 | 7.3 | 761 | 1.1 |
| 522. Transport equipment, other than passenger motor vehicles, non-industrial | 2,007 | 2.7 | 7 | 0.0 | 2,350 | 3.4 | ||||
| 53. Transport equipment, parts and accessories | 1,058 | 1.4 | 1,722 | 1.9 | 2,313 | 4.1 | 1,504 | 1.6 | 1,237 | 1.8 |
| 6. Consumer goods not elsewhere specified | 680 | 0.9 | 512 | 0.6 | 696 | 1.2 | 1,092 | 1.2 | 165 | 0.2 |
| 61. Consumer goods not elsewhere specified, durable | 5 | 0.0 | 10 | 0.0 | 7 | 0.0 | 12 | 0.0 | 12 | 0.0 |
| 62. Consumer goods not elsewhere specified, semi-durable | 50 | 0.1 | 68 | 0.1 | 65 | 0.1 | 104 | 0.1 | 61 | 0.1 |
| 63. Consumer goods not elsewhere specified, non-durable | 625 | 0.8 | 434 | 0.5 | 623 | 1.1 | 975 | 1.1 | 93 | 0.1 |
| 7. Goods not elsewhere specified | 1,880 | 2.0 | ||||||||
| All groups | 73,985 | 100.0 | 92,675 | 100.0 | 56,193 | 100.0 | 91,971 | 100.0 | 69,159 | 100.0 |
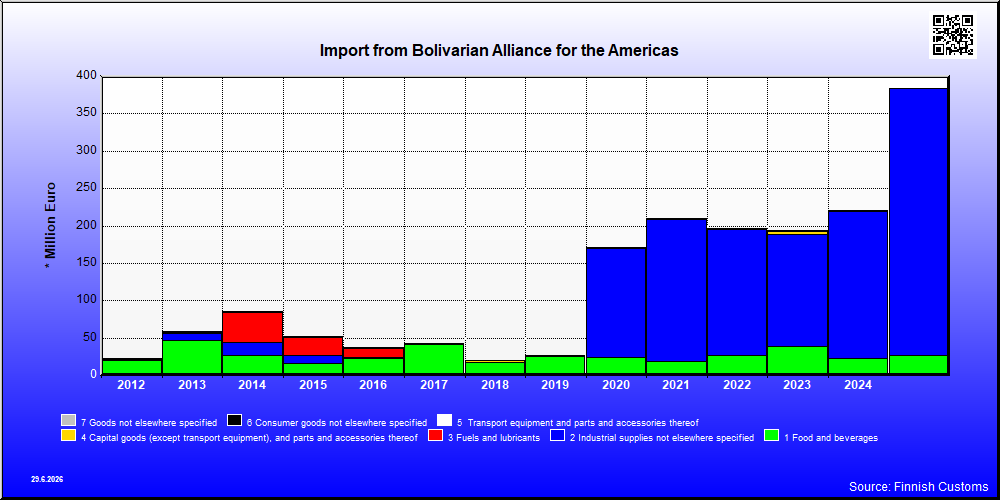
| 2021 | 2022 | 2023 | 2024 | 2025 | ||||||
|---|---|---|---|---|---|---|---|---|---|---|
| 1,000 € | % | 1,000 € | % | 1,000 € | % | 1,000 € | % | 1,000 € | % | |
| 1. Food and beverages | 19,329 | 9.2 | 26,621 | 13.6 | 38,772 | 20.1 | 22,855 | 10.3 | 27,188 | 7.1 |
| 11. Food and beverages, primary | 17,685 | 8.5 | 24,288 | 12.4 | 36,638 | 19.0 | 19,035 | 8.6 | 20,592 | 5.4 |
| 111. Food and beverages, primary, mainly for industry | 4,166 | 2.0 | 9,166 | 4.7 | 5,983 | 3.1 | 6,101 | 2.8 | 6,369 | 1.7 |
| 112. Food and beverages, primary, mainly for household consumption | 13,519 | 6.5 | 15,122 | 7.7 | 30,655 | 15.9 | 12,934 | 5.9 | 14,223 | 3.7 |
| 12. Food and beverages, processed | 1,645 | 0.8 | 2,333 | 1.2 | 2,134 | 1.1 | 3,820 | 1.7 | 6,596 | 1.7 |
| 121. Food and beverages, processed, mainly for industry | 24 | 0.0 | 197 | 0.1 | 37 | 0.0 | 38 | 0.0 | 36 | 0.0 |
| 122. Food and beverages, processed, mainly for household consumption | 1,621 | 0.8 | 2,137 | 1.1 | 2,097 | 1.1 | 3,782 | 1.7 | 6,560 | 1.7 |
| 2. Industrial supplies not elsewhere specified | 189,159 | 90.4 | 168,191 | 85.8 | 150,319 | 77.8 | 196,284 | 88.9 | 356,377 | 92.7 |
| 21. Industrial supplies not elsewhere specified, primary | 188,459 | 90.1 | 167,329 | 85.4 | 149,856 | 77.5 | 196,122 | 88.8 | 356,109 | 92.6 |
| 22. Industrial supplies not elsewhere specified, processed | 700 | 0.3 | 862 | 0.4 | 464 | 0.2 | 162 | 0.1 | 268 | 0.1 |
| 3. Fuels and lubricants | 37 | 0.0 | 137 | 0.1 | 71 | 0.0 | 61 | 0.0 | 80 | 0.0 |
| 32. Fuels and lubricants, processed | 37 | 0.0 | 137 | 0.1 | 71 | 0.0 | 61 | 0.0 | 80 | 0.0 |
| 322. Fuels and lubricants, other | 37 | 0.0 | 137 | 0.1 | 71 | 0.0 | 61 | 0.0 | 80 | 0.0 |
| 4. Capital goods (except transport equipment), and parts and accessories thereof | 214 | 0.1 | 357 | 0.2 | 3,364 | 1.7 | 100 | 0.0 | 225 | 0.1 |
| 41. Capital goods (except transport equipment) | 76 | 0.0 | 38 | 0.0 | 3,119 | 1.6 | 42 | 0.0 | 163 | 0.0 |
| 42. Capital goods (except transport equipment), parts and accessories | 139 | 0.1 | 319 | 0.2 | 245 | 0.1 | 58 | 0.0 | 62 | 0.0 |
| 5. Transport equipment and parts and accessories thereof | 52 | 0.0 | 10 | 0.0 | 116 | 0.1 | 7 | 0.0 | 26 | 0.0 |
| 51. Passenger motor vehicles | 38 | 0.0 | 2 | 0.0 | 6 | 0.0 | ||||
| 53. Transport equipment, parts and accessories | 14 | 0.0 | 9 | 0.0 | 116 | 0.1 | 7 | 0.0 | 19 | 0.0 |
| 6. Consumer goods not elsewhere specified | 427 | 0.2 | 697 | 0.4 | 691 | 0.4 | 1,605 | 0.7 | 571 | 0.1 |
| 61. Consumer goods not elsewhere specified, durable | 49 | 0.0 | 6 | 0.0 | 6 | 0.0 | 8 | 0.0 | 9 | 0.0 |
| 62. Consumer goods not elsewhere specified, semi-durable | 208 | 0.1 | 154 | 0.1 | 123 | 0.1 | 67 | 0.0 | 61 | 0.0 |
| 63. Consumer goods not elsewhere specified, non-durable | 206 | 0.1 | 538 | 0.3 | 563 | 0.3 | 1,530 | 0.7 | 502 | 0.1 |
| 7. Goods not elsewhere specified | 159 | 0.1 | 44 | 0.0 | 3 | 0.0 | 4 | 0.0 | 6 | 0.0 |
| All groups | 209,241 | 100.0 | 196,046 | 100.0 | 193,279 | 100.0 | 220,916 | 100.0 | 384,420 | 100.0 |
| Classification | Description | Year level | Quarter level | Month level | |
|---|---|---|---|---|---|
| SITC | Standard International Trade Classification (classification system is maintained by the United Nations) | ███ | ███ | ███ | |
| BEC | The standard of statistical classification of BEC (Broad Economic Categories) is upheld by the UN and it is based on SITC-nomenclature. | ███ | ███ | ███ | |
| NACE | National industrial classification based on Statistical Classification of Economic Activities in the European Community Nomenclature générale des Activités économiques dans les Communautés européennes | ███ | ███ | ███ | |
| CPA | CPA = Classification of Products by Activities | ███ | ███ | ███ | |
| CN | The Combined Nomenclature is the common nomenclature of the European Community. | ███ | ███ | ███ |