
| Export of goods from Finland and import to Finland | BEC (Broad Economic Categories) |
*) The standard of statistical classification of BEC (Broad Economic Categories) is upheld by the UN and it is based on SITC-nomenclature.
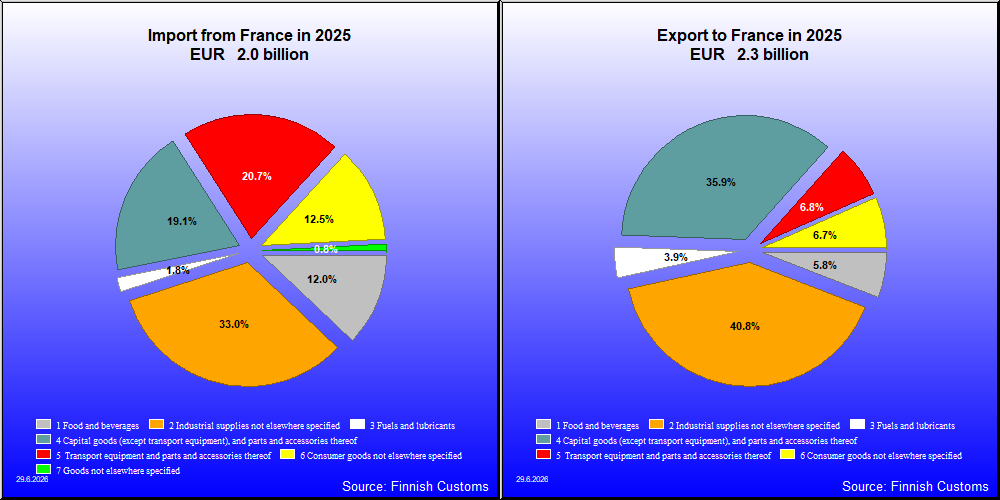

| 2021 | 2022 | 2023 | 2024 | 2025 | ||||||
|---|---|---|---|---|---|---|---|---|---|---|
| 1,000 € | % | 1,000 € | % | 1,000 € | % | 1,000 € | % | 1,000 € | % | |
| 1. Food and beverages | 72,529 | 3.5 | 117,129 | 4.7 | 92,008 | 3.7 | 112,884 | 4.9 | 135,307 | 5.8 |
| 11. Food and beverages, primary | 24,504 | 1.2 | 42,563 | 1.7 | 26,455 | 1.1 | 34,074 | 1.5 | 34,712 | 1.5 |
| 111. Food and beverages, primary, mainly for industry | 1 | 0.0 | 2,168 | 0.1 | 1,456 | 0.1 | 1,418 | 0.1 | ||
| 112. Food and beverages, primary, mainly for household consumption | 24,504 | 1.2 | 42,563 | 1.7 | 24,288 | 1.0 | 32,617 | 1.4 | 33,293 | 1.4 |
| 12. Food and beverages, processed | 48,024 | 2.3 | 74,567 | 3.0 | 65,553 | 2.6 | 78,810 | 3.4 | 100,596 | 4.3 |
| 121. Food and beverages, processed, mainly for industry | 2,003 | 0.1 | 2,241 | 0.1 | 5,073 | 0.2 | 3,971 | 0.2 | 3,557 | 0.2 |
| 122. Food and beverages, processed, mainly for household consumption | 46,021 | 2.2 | 72,326 | 2.9 | 60,480 | 2.4 | 74,839 | 3.3 | 97,039 | 4.2 |
| 2. Industrial supplies not elsewhere specified | 1,113,467 | 53.4 | 1,346,051 | 53.5 | 1,141,113 | 45.4 | 1,048,034 | 45.5 | 945,071 | 40.7 |
| 21. Industrial supplies not elsewhere specified, primary | 22,184 | 1.1 | 23,607 | 0.9 | 16,300 | 0.6 | 15,227 | 0.7 | 15,893 | 0.7 |
| 22. Industrial supplies not elsewhere specified, processed | 1,091,283 | 52.4 | 1,322,445 | 52.5 | 1,124,813 | 44.8 | 1,032,806 | 44.9 | 929,178 | 40.0 |
| 3. Fuels and lubricants | 71,268 | 3.4 | 57,718 | 2.3 | 89,202 | 3.5 | 60,314 | 2.6 | 91,004 | 3.9 |
| 31. Fuels and lubricants, primary | 790 | 0.0 | 1,179 | 0.0 | 290 | 0.0 | 297 | 0.0 | 1,068 | 0.0 |
| 32. Fuels and lubricants, processed | 70,478 | 3.4 | 56,539 | 2.2 | 88,915 | 3.5 | 60,017 | 2.6 | 89,937 | 3.9 |
| 321. Fuels and lubricants, motor spirit | 70,412 | 3.4 | ||||||||
| 322. Fuels and lubricants, other | 66 | 0.0 | 56,539 | 2.2 | 88,915 | 3.5 | 60,017 | 2.6 | 89,937 | 3.9 |
| 4. Capital goods (except transport equipment), and parts and accessories thereof | 597,532 | 28.7 | 764,993 | 30.4 | 908,464 | 36.1 | 826,493 | 35.9 | 831,101 | 35.8 |
| 41. Capital goods (except transport equipment) | 473,883 | 22.7 | 622,822 | 24.7 | 767,178 | 30.5 | 674,708 | 29.3 | 678,618 | 29.2 |
| 42. Capital goods (except transport equipment), parts and accessories | 123,649 | 5.9 | 142,171 | 5.6 | 141,286 | 5.6 | 151,785 | 6.6 | 152,483 | 6.6 |
| 5. Transport equipment and parts and accessories thereof | 93,767 | 4.5 | 90,458 | 3.6 | 170,145 | 6.8 | 135,997 | 5.9 | 157,531 | 6.8 |
| 51. Passenger motor vehicles | 1,801 | 0.1 | 132 | 0.0 | 1,711 | 0.1 | 1,439 | 0.1 | 653 | 0.0 |
| 52. Transport equipment, other than passenger motor vehicles | 33,200 | 1.6 | 36,905 | 1.5 | 68,212 | 2.7 | 66,980 | 2.9 | 48,715 | 2.1 |
| 521. Transport equipment, other than passenger motor vehicles, industrial | 16,906 | 0.8 | 24,855 | 1.0 | 41,512 | 1.7 | 44,944 | 2.0 | 40,344 | 1.7 |
| 522. Transport equipment, other than passenger motor vehicles, non-industrial | 16,294 | 0.8 | 12,049 | 0.5 | 26,701 | 1.1 | 22,036 | 1.0 | 8,371 | 0.4 |
| 53. Transport equipment, parts and accessories | 58,766 | 2.8 | 53,422 | 2.1 | 100,222 | 4.0 | 67,577 | 2.9 | 108,164 | 4.7 |
| 6. Consumer goods not elsewhere specified | 52,844 | 2.5 | 79,921 | 3.2 | 102,625 | 4.1 | 111,324 | 4.8 | 153,875 | 6.6 |
| 61. Consumer goods not elsewhere specified, durable | 7,629 | 0.4 | 7,190 | 0.3 | 6,945 | 0.3 | 11,781 | 0.5 | 14,523 | 0.6 |
| 62. Consumer goods not elsewhere specified, semi-durable | 23,153 | 1.1 | 36,919 | 1.5 | 42,791 | 1.7 | 40,087 | 1.7 | 41,574 | 1.8 |
| 63. Consumer goods not elsewhere specified, non-durable | 22,062 | 1.1 | 35,812 | 1.4 | 52,890 | 2.1 | 59,455 | 2.6 | 97,778 | 4.2 |
| 7. Goods not elsewhere specified | 82,230 | 3.9 | 61,803 | 2.5 | 9,547 | 0.4 | 6,765 | 0.3 | 6,398 | 0.3 |
| All groups | 2,083,637 | 100.0 | 2,518,075 | 100.0 | 2,513,105 | 100.0 | 2,301,811 | 100.0 | 2,320,287 | 100.0 |
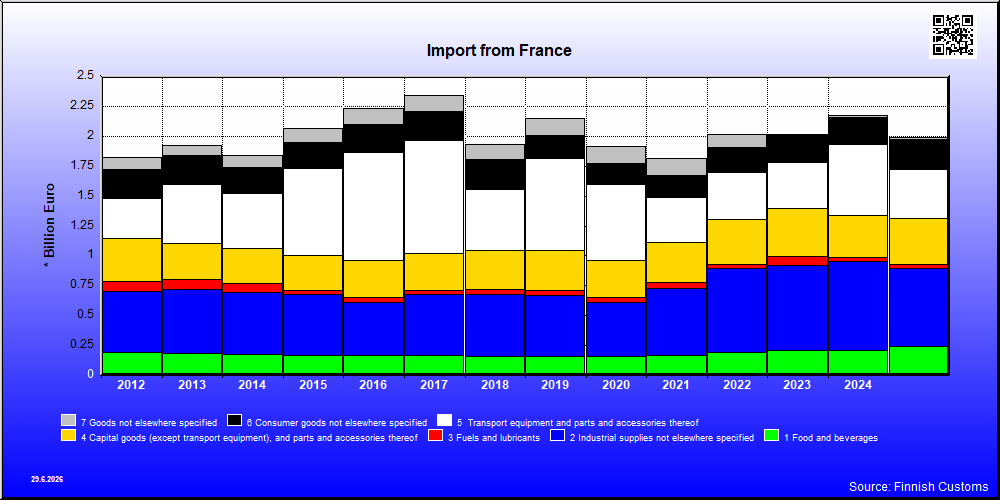
| 2021 | 2022 | 2023 | 2024 | 2025 | ||||||
|---|---|---|---|---|---|---|---|---|---|---|
| 1,000 € | % | 1,000 € | % | 1,000 € | % | 1,000 € | % | 1,000 € | % | |
| 1. Food and beverages | 166,039 | 9.2 | 193,241 | 9.6 | 208,692 | 10.4 | 212,733 | 9.8 | 239,191 | 12.0 |
| 11. Food and beverages, primary | 23,106 | 1.3 | 23,485 | 1.2 | 23,573 | 1.2 | 21,502 | 1.0 | 26,406 | 1.3 |
| 111. Food and beverages, primary, mainly for industry | 4,539 | 0.3 | 2,742 | 0.1 | 831 | 0.0 | 3,496 | 0.2 | 8,415 | 0.4 |
| 112. Food and beverages, primary, mainly for household consumption | 18,568 | 1.0 | 20,743 | 1.0 | 22,741 | 1.1 | 18,006 | 0.8 | 17,991 | 0.9 |
| 12. Food and beverages, processed | 142,933 | 7.9 | 169,756 | 8.4 | 185,119 | 9.2 | 191,231 | 8.8 | 212,785 | 10.7 |
| 121. Food and beverages, processed, mainly for industry | 9,777 | 0.5 | 9,615 | 0.5 | 13,844 | 0.7 | 14,384 | 0.7 | 41,545 | 2.1 |
| 122. Food and beverages, processed, mainly for household consumption | 133,156 | 7.3 | 160,140 | 8.0 | 171,275 | 8.5 | 176,847 | 8.1 | 171,240 | 8.6 |
| 2. Industrial supplies not elsewhere specified | 561,061 | 30.9 | 702,870 | 34.9 | 711,331 | 35.3 | 741,075 | 34.0 | 656,795 | 33.0 |
| 21. Industrial supplies not elsewhere specified, primary | 46,193 | 2.5 | 70,148 | 3.5 | 92,445 | 4.6 | 69,923 | 3.2 | 27,794 | 1.4 |
| 22. Industrial supplies not elsewhere specified, processed | 514,868 | 28.4 | 632,722 | 31.4 | 618,886 | 30.7 | 671,152 | 30.8 | 629,001 | 31.6 |
| 3. Fuels and lubricants | 48,288 | 2.7 | 32,747 | 1.6 | 76,192 | 3.8 | 33,060 | 1.5 | 35,763 | 1.8 |
| 32. Fuels and lubricants, processed | 48,288 | 2.7 | 32,747 | 1.6 | 76,192 | 3.8 | 33,060 | 1.5 | 35,763 | 1.8 |
| 321. Fuels and lubricants, motor spirit | 37,413 | 2.1 | 15 | 0.0 | 9,808 | 0.5 | 9 | 0.0 | 19 | 0.0 |
| 322. Fuels and lubricants, other | 10,875 | 0.6 | 32,732 | 1.6 | 66,384 | 3.3 | 33,054 | 1.5 | 35,744 | 1.8 |
| 4. Capital goods (except transport equipment), and parts and accessories thereof | 335,795 | 18.5 | 378,514 | 18.8 | 397,658 | 19.7 | 348,146 | 16.0 | 379,845 | 19.1 |
| 41. Capital goods (except transport equipment) | 193,157 | 10.6 | 218,247 | 10.8 | 236,018 | 11.7 | 211,833 | 9.7 | 219,670 | 11.1 |
| 42. Capital goods (except transport equipment), parts and accessories | 142,638 | 7.9 | 160,268 | 8.0 | 161,640 | 8.0 | 136,314 | 6.3 | 160,175 | 8.1 |
| 5. Transport equipment and parts and accessories thereof | 373,682 | 20.6 | 385,986 | 19.2 | 387,431 | 19.2 | 594,109 | 27.3 | 411,796 | 20.7 |
| 51. Passenger motor vehicles | 142,594 | 7.9 | 150,862 | 7.5 | 141,544 | 7.0 | 132,217 | 6.1 | 130,476 | 6.6 |
| 52. Transport equipment, other than passenger motor vehicles | 99,381 | 5.5 | 100,642 | 5.0 | 100,454 | 5.0 | 274,671 | 12.6 | 85,534 | 4.3 |
| 521. Transport equipment, other than passenger motor vehicles, industrial | 95,253 | 5.2 | 94,967 | 4.7 | 93,797 | 4.7 | 268,724 | 12.3 | 79,300 | 4.0 |
| 522. Transport equipment, other than passenger motor vehicles, non-industrial | 4,128 | 0.2 | 5,676 | 0.3 | 6,657 | 0.3 | 5,948 | 0.3 | 6,234 | 0.3 |
| 53. Transport equipment, parts and accessories | 131,707 | 7.3 | 134,482 | 6.7 | 145,432 | 7.2 | 187,220 | 8.6 | 195,786 | 9.9 |
| 6. Consumer goods not elsewhere specified | 185,156 | 10.2 | 213,960 | 10.6 | 231,045 | 11.5 | 231,489 | 10.6 | 247,794 | 12.5 |
| 61. Consumer goods not elsewhere specified, durable | 6,493 | 0.4 | 11,422 | 0.6 | 8,832 | 0.4 | 9,132 | 0.4 | 9,554 | 0.5 |
| 62. Consumer goods not elsewhere specified, semi-durable | 30,785 | 1.7 | 41,873 | 2.1 | 46,094 | 2.3 | 54,119 | 2.5 | 60,291 | 3.0 |
| 63. Consumer goods not elsewhere specified, non-durable | 147,879 | 8.1 | 160,666 | 8.0 | 176,118 | 8.7 | 168,239 | 7.7 | 177,949 | 9.0 |
| 7. Goods not elsewhere specified | 144,598 | 8.0 | 104,538 | 5.2 | 3,791 | 0.2 | 15,956 | 0.7 | 16,468 | 0.8 |
| All groups | 1,814,620 | 100.0 | 2,011,856 | 100.0 | 2,016,140 | 100.0 | 2,176,569 | 100.0 | 1,987,652 | 100.0 |
| Classification | Description | Year level | Quarter level | Month level | |
|---|---|---|---|---|---|
| SITC | Standard International Trade Classification (classification system is maintained by the United Nations) | ███ | ███ | ███ | |
| BEC | The standard of statistical classification of BEC (Broad Economic Categories) is upheld by the UN and it is based on SITC-nomenclature. | ███ | ███ | ███ | |
| NACE | National industrial classification based on Statistical Classification of Economic Activities in the European Community Nomenclature générale des Activités économiques dans les Communautés européennes | ███ | ███ | ███ | |
| CPA | CPA = Classification of Products by Activities | ███ | ███ | ███ | |
| CN | The Combined Nomenclature is the common nomenclature of the European Community. | ███ | ███ | ███ |