
| Export of goods from Finland and import to Finland | BEC (Broad Economic Categories) |
*) The standard of statistical classification of BEC (Broad Economic Categories) is upheld by the UN and it is based on SITC-nomenclature.
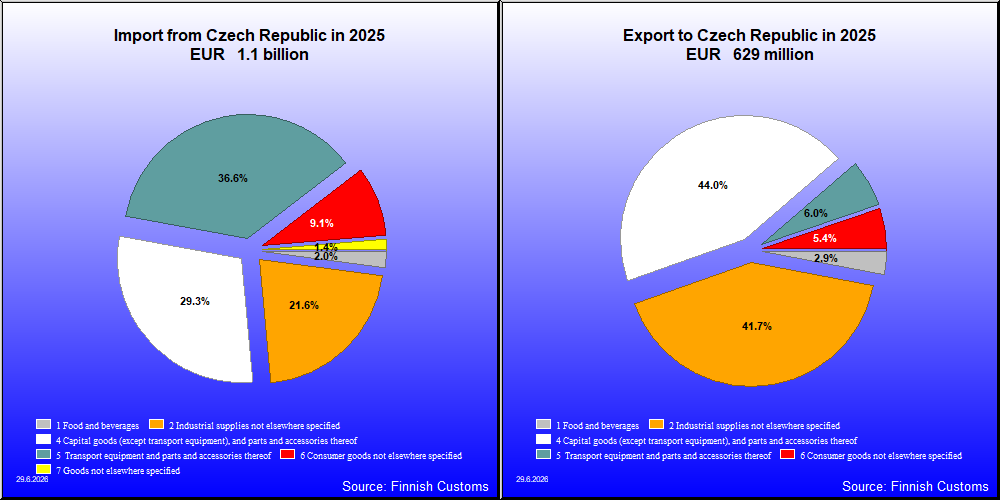
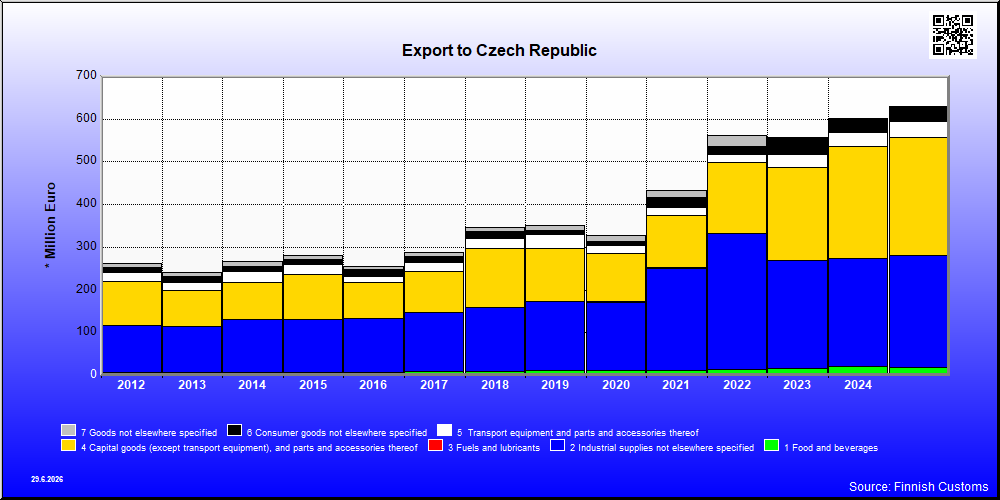
| 2021 | 2022 | 2023 | 2024 | 2025 | ||||||
|---|---|---|---|---|---|---|---|---|---|---|
| 1,000 € | % | 1,000 € | % | 1,000 € | % | 1,000 € | % | 1,000 € | % | |
| 1. Food and beverages | 12,187 | 2.8 | 14,508 | 2.6 | 16,161 | 2.9 | 21,757 | 3.6 | 18,395 | 2.9 |
| 11. Food and beverages, primary | 441 | 0.1 | 1,466 | 0.3 | 1,679 | 0.3 | 1,246 | 0.2 | 2,386 | 0.4 |
| 111. Food and beverages, primary, mainly for industry | 23 | 0.0 | ||||||||
| 112. Food and beverages, primary, mainly for household consumption | 441 | 0.1 | 1,466 | 0.3 | 1,679 | 0.3 | 1,246 | 0.2 | 2,364 | 0.4 |
| 12. Food and beverages, processed | 11,746 | 2.7 | 13,043 | 2.3 | 14,482 | 2.6 | 20,511 | 3.4 | 16,009 | 2.5 |
| 121. Food and beverages, processed, mainly for industry | 532 | 0.1 | 1,014 | 0.2 | 581 | 0.1 | 611 | 0.1 | 842 | 0.1 |
| 122. Food and beverages, processed, mainly for household consumption | 11,214 | 2.6 | 12,029 | 2.1 | 13,901 | 2.5 | 19,900 | 3.3 | 15,167 | 2.4 |
| 2. Industrial supplies not elsewhere specified | 239,158 | 55.1 | 317,499 | 56.6 | 252,210 | 45.2 | 251,095 | 41.7 | 261,775 | 41.6 |
| 21. Industrial supplies not elsewhere specified, primary | 29,729 | 6.9 | 29,484 | 5.3 | 11,610 | 2.1 | 8,951 | 1.5 | 9,295 | 1.5 |
| 22. Industrial supplies not elsewhere specified, processed | 209,429 | 48.3 | 288,014 | 51.4 | 240,600 | 43.2 | 242,145 | 40.2 | 252,480 | 40.2 |
| 3. Fuels and lubricants | 624 | 0.1 | 627 | 0.1 | 127 | 0.0 | 159 | 0.0 | 239 | 0.0 |
| 31. Fuels and lubricants, primary | 76 | 0.0 | 97 | 0.0 | 35 | 0.0 | 10 | 0.0 | 97 | 0.0 |
| 32. Fuels and lubricants, processed | 548 | 0.1 | 530 | 0.1 | 105 | 0.0 | 150 | 0.0 | 142 | 0.0 |
| 321. Fuels and lubricants, motor spirit | 547 | 0.1 | 410 | 0.1 | 25 | 0.0 | ||||
| 322. Fuels and lubricants, other | 1 | 0.0 | 120 | 0.0 | 105 | 0.0 | 125 | 0.0 | 142 | 0.0 |
| 4. Capital goods (except transport equipment), and parts and accessories thereof | 121,640 | 28.0 | 166,127 | 29.6 | 218,030 | 39.1 | 262,343 | 43.5 | 275,709 | 43.8 |
| 41. Capital goods (except transport equipment) | 79,852 | 18.4 | 117,465 | 20.9 | 162,914 | 29.2 | 161,263 | 26.8 | 155,710 | 24.8 |
| 42. Capital goods (except transport equipment), parts and accessories | 41,787 | 9.6 | 48,662 | 8.7 | 55,116 | 9.9 | 101,080 | 16.8 | 119,999 | 19.1 |
| 5. Transport equipment and parts and accessories thereof | 20,096 | 4.6 | 19,138 | 3.4 | 31,367 | 5.6 | 32,747 | 5.4 | 37,633 | 6.0 |
| 51. Passenger motor vehicles | 725 | 0.2 | 214 | 0.0 | 545 | 0.1 | 703 | 0.1 | 1,082 | 0.2 |
| 52. Transport equipment, other than passenger motor vehicles | 2,431 | 0.6 | 2,445 | 0.4 | 15,181 | 2.7 | 9,360 | 1.6 | 17,522 | 2.8 |
| 521. Transport equipment, other than passenger motor vehicles, industrial | 2,356 | 0.5 | 2,144 | 0.4 | 13,929 | 2.5 | 8,598 | 1.4 | 16,859 | 2.7 |
| 522. Transport equipment, other than passenger motor vehicles, non-industrial | 76 | 0.0 | 301 | 0.1 | 1,252 | 0.2 | 762 | 0.1 | 663 | 0.1 |
| 53. Transport equipment, parts and accessories | 16,940 | 3.9 | 16,479 | 2.9 | 15,641 | 2.8 | 22,684 | 3.8 | 19,029 | 3.0 |
| 6. Consumer goods not elsewhere specified | 21,890 | 5.0 | 19,186 | 3.4 | 36,967 | 6.6 | 33,057 | 5.5 | 33,762 | 5.4 |
| 61. Consumer goods not elsewhere specified, durable | 7,034 | 1.6 | 2,075 | 0.4 | 1,992 | 0.4 | 1,628 | 0.3 | 2,475 | 0.4 |
| 62. Consumer goods not elsewhere specified, semi-durable | 9,633 | 2.2 | 10,669 | 1.9 | 17,032 | 3.1 | 19,452 | 3.2 | 17,956 | 2.9 |
| 63. Consumer goods not elsewhere specified, non-durable | 5,223 | 1.2 | 6,442 | 1.1 | 17,943 | 3.2 | 11,978 | 2.0 | 13,331 | 2.1 |
| 7. Goods not elsewhere specified | 18,286 | 4.2 | 23,742 | 4.2 | 2,642 | 0.5 | 1,527 | 0.3 | 1,322 | 0.2 |
| All groups | 433,880 | 100.0 | 560,828 | 100.0 | 557,505 | 100.0 | 602,686 | 100.0 | 628,835 | 100.0 |
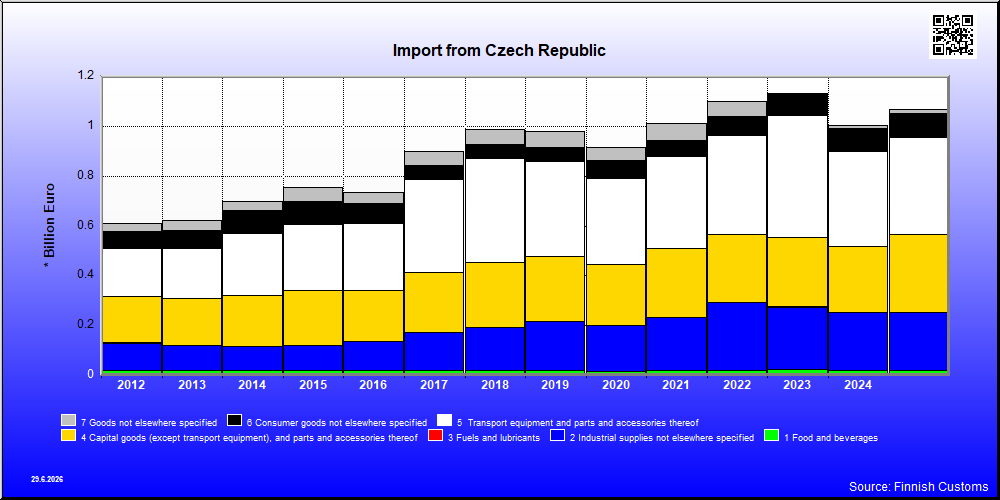
| 2021 | 2022 | 2023 | 2024 | 2025 | ||||||
|---|---|---|---|---|---|---|---|---|---|---|
| 1,000 € | % | 1,000 € | % | 1,000 € | % | 1,000 € | % | 1,000 € | % | |
| 1. Food and beverages | 21,413 | 2.1 | 20,730 | 1.9 | 23,526 | 2.1 | 20,953 | 2.1 | 21,418 | 2.0 |
| 11. Food and beverages, primary | 1,462 | 0.1 | 2,177 | 0.2 | 2,573 | 0.2 | 2,438 | 0.2 | 2,858 | 0.3 |
| 111. Food and beverages, primary, mainly for industry | 337 | 0.0 | 361 | 0.0 | 364 | 0.0 | 110 | 0.0 | 241 | 0.0 |
| 112. Food and beverages, primary, mainly for household consumption | 1,126 | 0.1 | 1,816 | 0.2 | 2,209 | 0.2 | 2,328 | 0.2 | 2,617 | 0.2 |
| 12. Food and beverages, processed | 19,951 | 2.0 | 18,553 | 1.7 | 20,953 | 1.8 | 18,515 | 1.8 | 18,560 | 1.7 |
| 121. Food and beverages, processed, mainly for industry | 74 | 0.0 | 196 | 0.0 | 23 | 0.0 | 62 | 0.0 | 738 | 0.1 |
| 122. Food and beverages, processed, mainly for household consumption | 19,877 | 2.0 | 18,357 | 1.7 | 20,929 | 1.8 | 18,453 | 1.8 | 17,822 | 1.7 |
| 2. Industrial supplies not elsewhere specified | 211,724 | 20.9 | 270,602 | 24.6 | 250,489 | 22.1 | 231,678 | 23.0 | 230,127 | 21.5 |
| 21. Industrial supplies not elsewhere specified, primary | 14,667 | 1.4 | 38,675 | 3.5 | 27,925 | 2.5 | 29,369 | 2.9 | 18,185 | 1.7 |
| 22. Industrial supplies not elsewhere specified, processed | 197,056 | 19.5 | 231,927 | 21.1 | 222,564 | 19.6 | 202,309 | 20.1 | 211,942 | 19.8 |
| 3. Fuels and lubricants | 91 | 0.0 | 181 | 0.0 | 1,707 | 0.2 | 1,078 | 0.1 | 1,023 | 0.1 |
| 31. Fuels and lubricants, primary | 260 | 0.0 | 852 | 0.1 | 809 | 0.1 | ||||
| 32. Fuels and lubricants, processed | 91 | 0.0 | 181 | 0.0 | 1,448 | 0.1 | 226 | 0.0 | 214 | 0.0 |
| 321. Fuels and lubricants, motor spirit | 69 | 0.0 | 2 | 0.0 | ||||||
| 322. Fuels and lubricants, other | 22 | 0.0 | 181 | 0.0 | 1,446 | 0.1 | 226 | 0.0 | 214 | 0.0 |
| 4. Capital goods (except transport equipment), and parts and accessories thereof | 276,473 | 27.3 | 275,119 | 25.1 | 279,641 | 24.7 | 264,365 | 26.3 | 312,968 | 29.3 |
| 41. Capital goods (except transport equipment) | 166,605 | 16.4 | 144,644 | 13.2 | 156,439 | 13.8 | 160,459 | 16.0 | 193,891 | 18.1 |
| 42. Capital goods (except transport equipment), parts and accessories | 109,868 | 10.8 | 130,475 | 11.9 | 123,202 | 10.9 | 103,906 | 10.3 | 119,077 | 11.1 |
| 5. Transport equipment and parts and accessories thereof | 368,260 | 36.4 | 394,742 | 35.9 | 488,561 | 43.1 | 381,641 | 38.0 | 390,606 | 36.6 |
| 51. Passenger motor vehicles | 223,565 | 22.1 | 262,253 | 23.9 | 384,342 | 33.9 | 280,417 | 27.9 | 297,344 | 27.8 |
| 52. Transport equipment, other than passenger motor vehicles | 2,864 | 0.3 | 7,799 | 0.7 | 7,714 | 0.7 | 8,321 | 0.8 | 7,337 | 0.7 |
| 521. Transport equipment, other than passenger motor vehicles, industrial | 845 | 0.1 | 602 | 0.1 | 546 | 0.0 | 650 | 0.1 | 3,680 | 0.3 |
| 522. Transport equipment, other than passenger motor vehicles, non-industrial | 2,019 | 0.2 | 7,196 | 0.7 | 7,169 | 0.6 | 7,671 | 0.8 | 3,657 | 0.3 |
| 53. Transport equipment, parts and accessories | 141,831 | 14.0 | 124,690 | 11.4 | 96,505 | 8.5 | 92,904 | 9.2 | 85,926 | 8.0 |
| 6. Consumer goods not elsewhere specified | 65,010 | 6.4 | 78,567 | 7.2 | 84,560 | 7.5 | 92,192 | 9.2 | 97,187 | 9.1 |
| 61. Consumer goods not elsewhere specified, durable | 21,677 | 2.1 | 19,982 | 1.8 | 19,660 | 1.7 | 17,652 | 1.8 | 18,621 | 1.7 |
| 62. Consumer goods not elsewhere specified, semi-durable | 16,839 | 1.7 | 22,163 | 2.0 | 24,689 | 2.2 | 29,145 | 2.9 | 39,527 | 3.7 |
| 63. Consumer goods not elsewhere specified, non-durable | 26,494 | 2.6 | 36,422 | 3.3 | 40,211 | 3.5 | 45,395 | 4.5 | 39,039 | 3.7 |
| 7. Goods not elsewhere specified | 69,992 | 6.9 | 58,328 | 5.3 | 4,239 | 0.4 | 13,441 | 1.3 | 15,186 | 1.4 |
| All groups | 1,012,963 | 100.0 | 1,098,269 | 100.0 | 1,132,724 | 100.0 | 1,005,349 | 100.0 | 1,068,516 | 100.0 |
| Classification | Description | Year level | Quarter level | Month level | |
|---|---|---|---|---|---|
| SITC | Standard International Trade Classification (classification system is maintained by the United Nations) | ███ | ███ | ███ | |
| BEC | The standard of statistical classification of BEC (Broad Economic Categories) is upheld by the UN and it is based on SITC-nomenclature. | ███ | ███ | ███ | |
| NACE | National industrial classification based on Statistical Classification of Economic Activities in the European Community Nomenclature générale des Activités économiques dans les Communautés européennes | ███ | ███ | ███ | |
| CPA | CPA = Classification of Products by Activities | ███ | ███ | ███ | |
| CN | The Combined Nomenclature is the common nomenclature of the European Community. | ███ | ███ | ███ |