
| Export of goods from Finland and import to Finland | Trade Balance |

| Year | Month | Import 1,000 € | Export 1,000 € | Trade 1,000 € | Trade Balance 1,000 € |
|---|---|---|---|---|---|
| 2023 | 1 | 33,898 | 47,418 | 81,316 | 13,520 |
| 2023 | 2 | 17,942 | 30,150 | 48,093 | 12,208 |
| 2023 | 3 | 17,899 | 42,328 | 60,228 | 24,429 |
| 2023 | 4 | 11,500 | 30,924 | 42,424 | 19,424 |
| 2023 | 5 | 29,318 | 39,208 | 68,526 | 9,889 |
| 2023 | 6 | 18,704 | 37,408 | 56,112 | 18,704 |
| 2023 | 7 | 16,708 | 23,915 | 40,622 | 7,207 |
| 2023 | 8 | 16,410 | 36,155 | 52,565 | 19,745 |
| 2023 | 9 | 13,214 | 33,744 | 46,958 | 20,529 |
| 2023 | 10 | 15,968 | 34,644 | 50,613 | 18,676 |
| 2023 | 11 | 10,957 | 25,960 | 36,917 | 15,002 |
| 2023 | 12 | 9,391 | 33,765 | 43,156 | 24,373 |
| 2024 | 1 | 15,985 | 30,694 | 46,680 | 14,709 |
| 2024 | 2 | 17,048 | 43,814 | 60,862 | 26,766 |
| 2024 | 3 | 9,333 | 19,765 | 29,098 | 10,433 |
| 2024 | 4 | 16,006 | 31,688 | 47,694 | 15,682 |
| 2024 | 5 | 14,417 | 32,924 | 47,342 | 18,507 |
| 2024 | 6 | 13,960 | 33,638 | 47,598 | 19,678 |
| 2024 | 7 | 14,388 | 31,039 | 45,427 | 16,650 |
| 2024 | 8 | 12,366 | 25,652 | 38,018 | 13,286 |
| 2024 | 9 | 11,222 | 31,252 | 42,474 | 20,030 |
| 2024 | 10 | 11,324 | 33,843 | 45,167 | 22,518 |
| 2024 | 11 | 13,740 | 28,343 | 42,082 | 14,603 |
| 2024 | 12 | 11,717 | 33,405 | 45,122 | 21,687 |
| 2025 | 1 | 16,000 | 40,403 | 56,403 | 24,403 |
| 2025 | 2 | 15,488 | 34,058 | 49,546 | 18,571 |
| 2025 | 3 | 17,731 | 22,680 | 40,411 | 4,949 |
| 2025 | 4 | 11,595 | 39,719 | 51,314 | 28,124 |
| 2025 | 5 | 12,400 | 23,716 | 36,117 | 11,316 |
| 2025 | 6 | 11,318 | 34,558 | 45,876 | 23,240 |
| 2025 | 7 | 10,127 | 25,804 | 35,931 | 15,677 |
| 2025 | 8 | 8,699 | 27,880 | 36,578 | 19,181 |
| 2025 | 9 | 11,151 | 29,531 | 40,683 | 18,380 |
| 2025 | 10 | 11,554 | 34,525 | 46,079 | 22,971 |
| 2025 | 11 | 6,810 | 28,896 | 35,706 | 22,087 |
| 2025 | 12 | 7,136 | 29,800 | 36,936 | 22,664 |
| 2026 | 1 | 6,008 | 28,368 | 34,376 | 22,360 |
| 2026 | 2 | 7,503 | 32,099 | 39,602 | 24,596 |
| 2026 | 3 | 8,647 | 47,240 | 55,887 | 38,594 |
| 2026 | 4 | 8,915 | 42,776 | 51,691 | 33,861 |
| 2026 | 5 | 5,998 | 45,797 | 51,796 | 39,799 |
| 2026 | 6 | 9,572 | 40,487 | 50,060 | 30,915 |
| 2026 | 7 | 8,039 | 34,971 | 43,010 | 26,932 |
| 2026 | 8 | 9,731 | 44,917 | 54,648 | 35,185 |
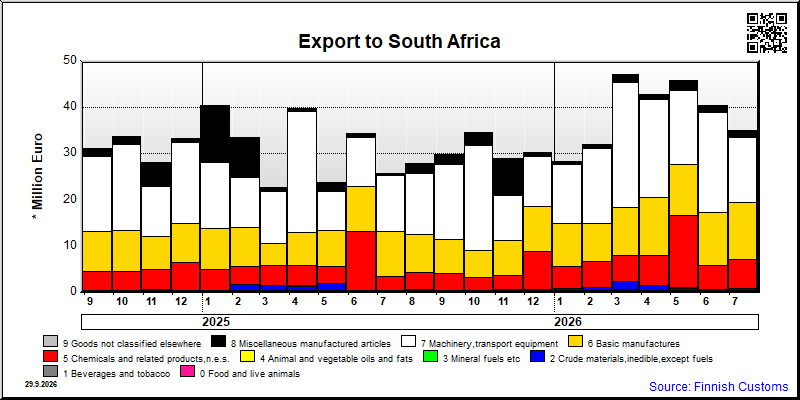
| 2026/4 | 2026/5 | 2026/6 | 2026/7 | 2026/8 | ||||||
|---|---|---|---|---|---|---|---|---|---|---|
| 1000 € | % | 1000 € | % | 1000 € | % | 1000 € | % | 1000 € | % | |
| 0. Food and live animals | 408 | 1.0 | 408 | 0.9 | 370 | 0.9 | 214 | 0.6 | 178 | 0.4 |
| 1. Beverages and tobacco | 7 | 0.0 | 27 | 0.1 | ||||||
| 2. Crude materials,inedible,except fuels | 1,110 | 2.6 | 552 | 1.2 | 203 | 0.5 | 661 | 1.9 | 813 | 1.8 |
| 3. Mineral fuels etc | 25 | 0.1 | ||||||||
| 4. Animal and vegetable oils and fats | 30 | 0.1 | ||||||||
| 5. Chemicals and related products,n.e.s. | 6,549 | 15.3 | 15,614 | 34.1 | 5,219 | 12.9 | 6,192 | 17.7 | 15,519 | 34.6 |
| 6. Basic manufactures | 12,553 | 29.3 | 11,175 | 24.4 | 11,579 | 28.6 | 12,302 | 35.2 | 10,076 | 22.4 |
| 7. Machinery,transport equipment | 21,022 | 49.1 | 16,038 | 35.0 | 21,618 | 53.4 | 14,036 | 40.1 | 16,885 | 37.6 |
| 8. Miscellaneous manufactured articles | 1,134 | 2.7 | 1,982 | 4.3 | 1,491 | 3.7 | 1,514 | 4.3 | 1,445 | 3.2 |
| All groups combined | 42,776 | 100.0 | 45,797 | 100.0 | 40,487 | 100.0 | 34,971 | 100.0 | 44,917 | 100.0 |

| 2026/4 | 2026/5 | 2026/6 | 2026/7 | 2026/8 | ||||||
|---|---|---|---|---|---|---|---|---|---|---|
| 1000 € | % | 1000 € | % | 1000 € | % | 1000 € | % | 1000 € | % | |
| 0. Food and live animals | 2,617 | 29.4 | 1,832 | 30.5 | 3,036 | 31.7 | 3,287 | 40.9 | 4,134 | 42.5 |
| 1. Beverages and tobacco | 470 | 5.3 | 349 | 5.8 | 573 | 6.0 | 360 | 4.5 | 463 | 4.8 |
| 2. Crude materials,inedible,except fuels | 108 | 1.2 | 110 | 1.8 | 118 | 1.2 | 95 | 1.2 | 84 | 0.9 |
| 3. Mineral fuels etc | 11 | 0.1 | 34 | 0.6 | 101 | 1.1 | 21 | 0.3 | 40 | 0.4 |
| 4. Animal and vegetable oils and fats | 2 | 0.0 | ||||||||
| 5. Chemicals and related products,n.e.s. | 374 | 4.2 | 528 | 8.8 | 400 | 4.2 | 160 | 2.0 | 536 | 5.5 |
| 6. Basic manufactures | 879 | 9.9 | 971 | 16.2 | 1,490 | 15.6 | 1,663 | 20.7 | 1,905 | 19.6 |
| 7. Machinery,transport equipment | 4,347 | 48.8 | 1,935 | 32.3 | 3,530 | 36.9 | 2,253 | 28.0 | 1,782 | 18.3 |
| 8. Miscellaneous manufactured articles | 109 | 1.2 | 237 | 3.9 | 323 | 3.4 | 197 | 2.5 | 785 | 8.1 |
| 9. Goods not classified elsewhere | 2 | 0.0 | 2 | 0.0 | 2 | 0.0 | 2 | 0.0 | 2 | 0.0 |
| All groups combined | 8,915 | 100.0 | 5,998 | 100.0 | 9,572 | 100.0 | 8,039 | 100.0 | 9,731 | 100.0 |
| Classification | Description | Year level | Quarter level | Month level | Year 2026 sofar |
|---|---|---|---|---|---|
| SITC | Standard International Trade Classification (classification system is maintained by the United Nations) | ███ | ███ | ███ | ███ |
| BEC | The standard of statistical classification of BEC (Broad Economic Categories) is upheld by the UN and it is based on SITC-nomenclature. | ███ | ███ | ███ | ███ |
| NACE | National industrial classification based on Statistical Classification of Economic Activities in the European Community Nomenclature générale des Activités économiques dans les Communautés européennes | ███ | ███ | ███ | ███ |
| CPA | CPA = Classification of Products by Activities | ███ | ███ | ███ | ███ |
| CN | The Combined Nomenclature is the common nomenclature of the European Community. | ███ | ███ | ███ | ███ |