
| Export of goods from Finland and import to Finland | BEC (Broad Economic Categories) |
*) The standard of statistical classification of BEC (Broad Economic Categories) is upheld by the UN and it is based on SITC-nomenclature.
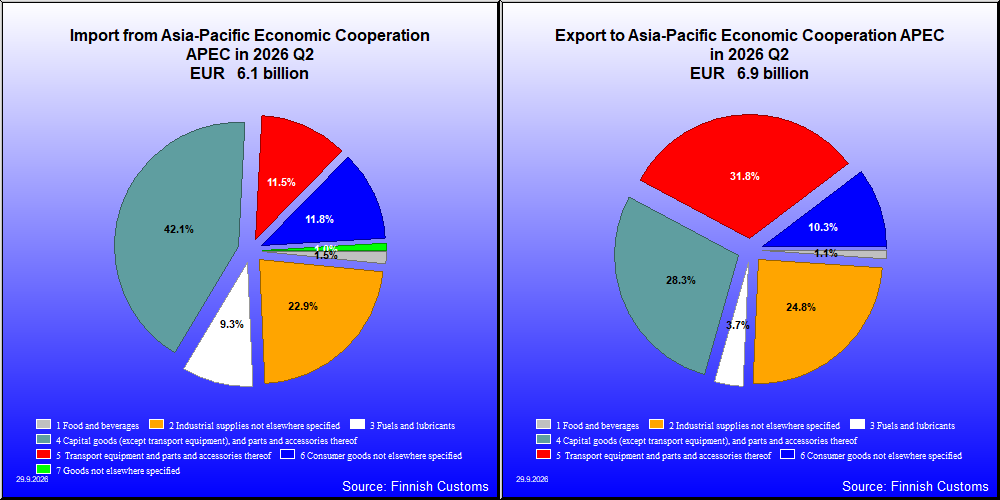
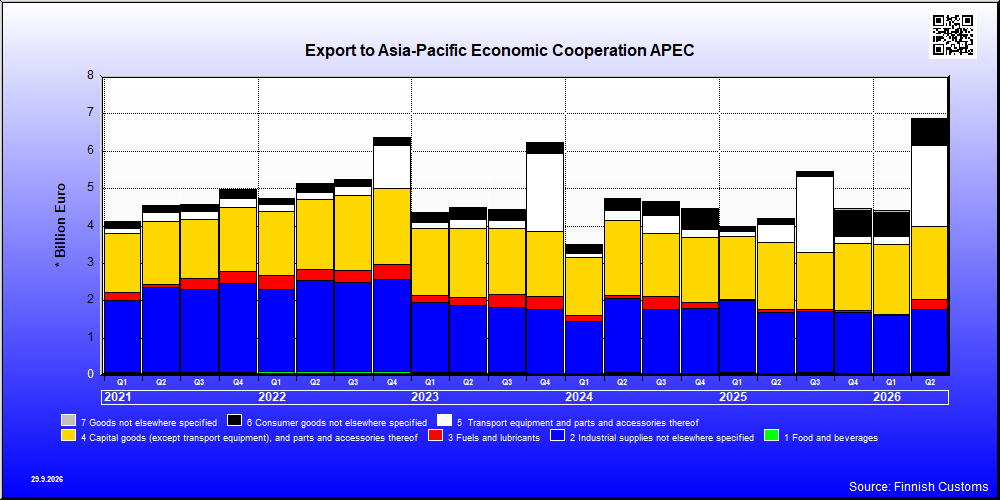
| Q2 / 2026 | Q2 / 2025 | Muutos edellisestä vastaavasta kaudesta % | ||
|---|---|---|---|---|
| 1,000 € | % | 1,000 € | ||
| 1. Food and beverages | 72,703 | 1.1 | 64,040 | 13.5 |
| 11. Food and beverages, primary | 5,473 | 0.1 | 2,888 | 89.5 |
| 111. Food and beverages, primary, mainly for industry | 3 | 0.0 | 9 | -62.5 |
| 112. Food and beverages, primary, mainly for household consumption | 5,470 | 0.1 | 2,879 | 90.0 |
| 12. Food and beverages, processed | 67,229 | 1.0 | 61,152 | 9.9 |
| 121. Food and beverages, processed, mainly for industry | 30,593 | 0.4 | 25,186 | 21.5 |
| 122. Food and beverages, processed, mainly for household consumption | 36,636 | 0.5 | 35,965 | 1.9 |
| 2. Industrial supplies not elsewhere specified | 1,705,423 | 24.7 | 1,628,169 | 4.7 |
| 21. Industrial supplies not elsewhere specified, primary | 201,742 | 2.9 | 95,156 | 112.0 |
| 22. Industrial supplies not elsewhere specified, processed | 1,503,681 | 21.8 | 1,533,013 | -1.9 |
| 3. Fuels and lubricants | 254,665 | 3.7 | 73,597 | 246.0 |
| 31. Fuels and lubricants, primary | 1,542 | 0.0 | 1,528 | 0.9 |
| 32. Fuels and lubricants, processed | 253,122 | 3.7 | 72,069 | 251.2 |
| 321. Fuels and lubricants, motor spirit | 252,282 | 3.7 | 71,695 | 251.9 |
| 322. Fuels and lubricants, other | 840 | 0.0 | 374 | 124.7 |
| 4. Capital goods (except transport equipment), and parts and accessories thereof | 1,947,806 | 28.3 | 1,793,932 | 8.6 |
| 41. Capital goods (except transport equipment) | 1,351,386 | 19.6 | 1,316,801 | 2.6 |
| 42. Capital goods (except transport equipment), parts and accessories | 596,420 | 8.7 | 477,131 | 25.0 |
| 5. Transport equipment and parts and accessories thereof | 2,191,196 | 31.8 | 493,440 | 344.1 |
| 51. Passenger motor vehicles | 483 | 0.0 | 1,023 | -52.8 |
| 52. Transport equipment, other than passenger motor vehicles | 2,033,506 | 29.5 | 360,919 | 463.4 |
| 521. Transport equipment, other than passenger motor vehicles, industrial | 2,010,694 | 29.2 | 348,259 | 477.4 |
| 522. Transport equipment, other than passenger motor vehicles, non-industrial | 22,811 | 0.3 | 12,779 | 78.5 |
| 53. Transport equipment, parts and accessories | 157,208 | 2.3 | 131,498 | 19.6 |
| 6. Consumer goods not elsewhere specified | 711,837 | 10.3 | 118,444 | 501.0 |
| 61. Consumer goods not elsewhere specified, durable | 32,105 | 0.5 | 35,557 | -9.7 |
| 62. Consumer goods not elsewhere specified, semi-durable | 46,908 | 0.7 | 38,814 | 20.9 |
| 63. Consumer goods not elsewhere specified, non-durable | 632,824 | 9.2 | 44,073 | .. |
| 7. Goods not elsewhere specified | 10,999 | 0.2 | 25,763 | -57.3 |
| All groups | 6,894,628 | 100.0 | 4,197,385 | 64.3 |

| Q2 / 2026 | Q2 / 2025 | Muutos edellisestä vastaavasta kaudesta % | ||
|---|---|---|---|---|
| 1,000 € | % | 1,000 € | ||
| 1. Food and beverages | 92,450 | 1.5 | 85,680 | 7.9 |
| 11. Food and beverages, primary | 26,981 | 0.4 | 21,915 | 23.1 |
| 111. Food and beverages, primary, mainly for industry | 5,432 | 0.1 | 4,372 | 24.3 |
| 112. Food and beverages, primary, mainly for household consumption | 21,548 | 0.4 | 17,544 | 22.8 |
| 12. Food and beverages, processed | 65,469 | 1.1 | 63,764 | 2.7 |
| 121. Food and beverages, processed, mainly for industry | 3,354 | 0.1 | 715 | 368.9 |
| 122. Food and beverages, processed, mainly for household consumption | 62,118 | 1.0 | 63,049 | -1.5 |
| 2. Industrial supplies not elsewhere specified | 1,393,292 | 23.1 | 1,054,972 | 32.1 |
| 21. Industrial supplies not elsewhere specified, primary | 325,037 | 5.4 | 136,765 | 137.7 |
| 22. Industrial supplies not elsewhere specified, processed | 1,068,255 | 17.7 | 918,207 | 16.3 |
| 3. Fuels and lubricants | 568,037 | 9.4 | 456,507 | 24.4 |
| 31. Fuels and lubricants, primary | 366,368 | 6.1 | 215,354 | 70.1 |
| 32. Fuels and lubricants, processed | 201,669 | 3.3 | 241,153 | -16.4 |
| 321. Fuels and lubricants, motor spirit | 24 | 0.0 | 7 | 262.7 |
| 322. Fuels and lubricants, other | 201,645 | 3.3 | 241,147 | -16.4 |
| 4. Capital goods (except transport equipment), and parts and accessories thereof | 2,536,452 | 42.0 | 1,598,805 | 58.6 |
| 41. Capital goods (except transport equipment) | 1,803,099 | 29.8 | 1,184,169 | 52.3 |
| 42. Capital goods (except transport equipment), parts and accessories | 733,352 | 12.1 | 414,636 | 76.9 |
| 5. Transport equipment and parts and accessories thereof | 677,328 | 11.2 | 580,435 | 16.7 |
| 51. Passenger motor vehicles | 180,684 | 3.0 | 137,253 | 31.6 |
| 52. Transport equipment, other than passenger motor vehicles | 100,624 | 1.7 | 100,249 | 0.4 |
| 521. Transport equipment, other than passenger motor vehicles, industrial | 64,921 | 1.1 | 64,278 | 1.0 |
| 522. Transport equipment, other than passenger motor vehicles, non-industrial | 35,702 | 0.6 | 35,971 | -0.7 |
| 53. Transport equipment, parts and accessories | 396,050 | 6.6 | 342,933 | 15.5 |
| 6. Consumer goods not elsewhere specified | 713,637 | 11.8 | 543,160 | 31.4 |
| 61. Consumer goods not elsewhere specified, durable | 189,541 | 3.1 | 160,212 | 18.3 |
| 62. Consumer goods not elsewhere specified, semi-durable | 378,609 | 6.3 | 280,221 | 35.1 |
| 63. Consumer goods not elsewhere specified, non-durable | 145,488 | 2.4 | 102,727 | 41.6 |
| 7. Goods not elsewhere specified | 62,558 | 1.0 | 68,840 | -9.1 |
| All groups | 6,043,753 | 100.0 | 4,388,398 | 37.7 |
| Classification | Description | Year level | Quarter level | Month level | Year 2026 sofar |
|---|---|---|---|---|---|
| SITC | Standard International Trade Classification (classification system is maintained by the United Nations) | ███ | ███ | ███ | ███ |
| BEC | The standard of statistical classification of BEC (Broad Economic Categories) is upheld by the UN and it is based on SITC-nomenclature. | ███ | ███ | ███ | ███ |
| NACE | National industrial classification based on Statistical Classification of Economic Activities in the European Community Nomenclature générale des Activités économiques dans les Communautés européennes | ███ | ███ | ███ | ███ |
| CPA | CPA = Classification of Products by Activities | ███ | ███ | ███ | ███ |
| CN | The Combined Nomenclature is the common nomenclature of the European Community. | ███ | ███ | ███ | ███ |