
| Export of goods from Finland and import to Finland | BEC (Broad Economic Categories) |
*) The standard of statistical classification of BEC (Broad Economic Categories) is upheld by the UN and it is based on SITC-nomenclature.


| Q2 / 2026 | Q2 / 2025 | Muutos edellisestä vastaavasta kaudesta % | ||
|---|---|---|---|---|
| 1,000 € | % | 1,000 € | ||
| 1. Food and beverages | 18,957 | 2.7 | 16,587 | 14.3 |
| 11. Food and beverages, primary | 2,368 | 0.3 | 2,922 | -19.0 |
| 111. Food and beverages, primary, mainly for industry | 39 | 0.0 | 0 | .. |
| 112. Food and beverages, primary, mainly for household consumption | 2,329 | 0.3 | 2,921 | -20.3 |
| 12. Food and beverages, processed | 16,589 | 2.4 | 13,665 | 21.4 |
| 121. Food and beverages, processed, mainly for industry | 13,933 | 2.0 | 10,894 | 27.9 |
| 122. Food and beverages, processed, mainly for household consumption | 2,656 | 0.4 | 2,771 | -4.1 |
| 2. Industrial supplies not elsewhere specified | 347,559 | 49.9 | 234,942 | 47.9 |
| 21. Industrial supplies not elsewhere specified, primary | 169,451 | 24.3 | 79,767 | 112.4 |
| 22. Industrial supplies not elsewhere specified, processed | 178,108 | 25.6 | 155,175 | 14.8 |
| 3. Fuels and lubricants | 660 | 0.1 | 146 | 352.8 |
| 31. Fuels and lubricants, primary | 619 | 0.1 | 111 | 457.5 |
| 32. Fuels and lubricants, processed | 41 | 0.0 | 35 | 18.6 |
| 322. Fuels and lubricants, other | 41 | 0.0 | 35 | 18.6 |
| 4. Capital goods (except transport equipment), and parts and accessories thereof | 285,785 | 41.1 | 301,970 | -5.4 |
| 41. Capital goods (except transport equipment) | 125,895 | 18.1 | 143,309 | -12.2 |
| 42. Capital goods (except transport equipment), parts and accessories | 159,891 | 23.0 | 158,661 | 0.8 |
| 5. Transport equipment and parts and accessories thereof | 28,162 | 4.0 | 17,111 | 64.6 |
| 51. Passenger motor vehicles | 0 | 0 | 308 | .. |
| 52. Transport equipment, other than passenger motor vehicles | 2,933 | 0.4 | 2,976 | -1.4 |
| 521. Transport equipment, other than passenger motor vehicles, industrial | 2,933 | 0.4 | 2,976 | -1.4 |
| 53. Transport equipment, parts and accessories | 25,229 | 3.6 | 13,827 | 82.5 |
| 6. Consumer goods not elsewhere specified | 13,896 | 2.0 | 8,197 | 69.5 |
| 61. Consumer goods not elsewhere specified, durable | 791 | 0.1 | 682 | 15.9 |
| 62. Consumer goods not elsewhere specified, semi-durable | 5,895 | 0.8 | 4,050 | 45.6 |
| 63. Consumer goods not elsewhere specified, non-durable | 7,210 | 1.0 | 3,465 | 108.1 |
| 7. Goods not elsewhere specified | 1,049 | 0.2 | 112 | 833.0 |
| All groups | 696,068 | 100.0 | 579,064 | 20.2 |
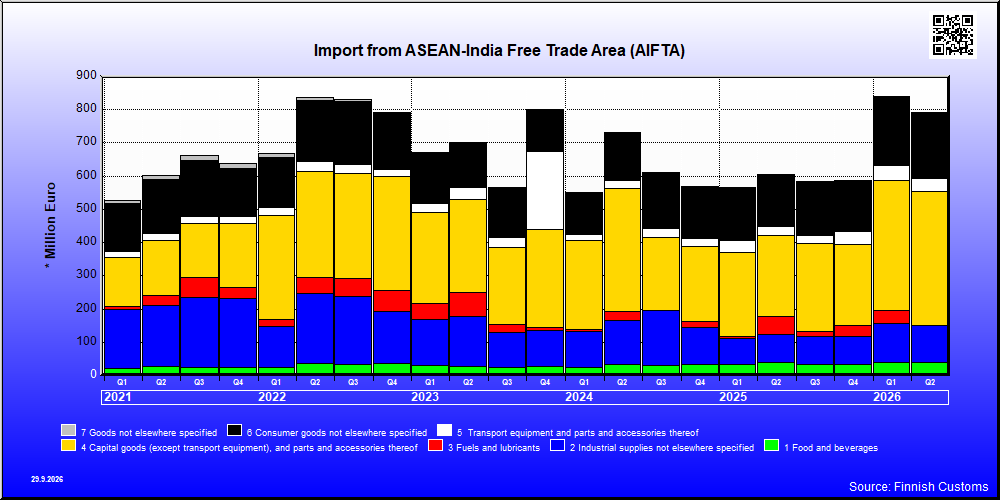
| Q2 / 2026 | Q2 / 2025 | Muutos edellisestä vastaavasta kaudesta % | ||
|---|---|---|---|---|
| 1,000 € | % | 1,000 € | ||
| 1. Food and beverages | 40,554 | 5.1 | 38,731 | 4.7 |
| 11. Food and beverages, primary | 10,240 | 1.3 | 8,464 | 21.0 |
| 111. Food and beverages, primary, mainly for industry | 1,127 | 0.1 | 2,096 | -46.2 |
| 112. Food and beverages, primary, mainly for household consumption | 9,113 | 1.2 | 6,368 | 43.1 |
| 12. Food and beverages, processed | 30,314 | 3.8 | 30,267 | 0.2 |
| 121. Food and beverages, processed, mainly for industry | 801 | 0.1 | 398 | 101.3 |
| 122. Food and beverages, processed, mainly for household consumption | 29,512 | 3.7 | 29,869 | -1.2 |
| 2. Industrial supplies not elsewhere specified | 110,015 | 13.9 | 83,951 | 31.0 |
| 21. Industrial supplies not elsewhere specified, primary | 9,250 | 1.2 | 8,979 | 3.0 |
| 22. Industrial supplies not elsewhere specified, processed | 100,765 | 12.7 | 74,972 | 34.4 |
| 3. Fuels and lubricants | 220 | 0.0 | 55,788 | -99.6 |
| 32. Fuels and lubricants, processed | 220 | 0.0 | 55,788 | -99.6 |
| 322. Fuels and lubricants, other | 220 | 0.0 | 55,788 | -99.6 |
| 4. Capital goods (except transport equipment), and parts and accessories thereof | 401,638 | 50.8 | 241,878 | 66.1 |
| 41. Capital goods (except transport equipment) | 291,632 | 36.9 | 186,274 | 56.6 |
| 42. Capital goods (except transport equipment), parts and accessories | 110,006 | 13.9 | 55,604 | 97.8 |
| 5. Transport equipment and parts and accessories thereof | 40,787 | 5.2 | 28,133 | 45.0 |
| 51. Passenger motor vehicles | 1,458 | 0.2 | 134 | 991.1 |
| 52. Transport equipment, other than passenger motor vehicles | 7,244 | 0.9 | 3,526 | 105.5 |
| 521. Transport equipment, other than passenger motor vehicles, industrial | 1,959 | 0.2 | 936 | 109.2 |
| 522. Transport equipment, other than passenger motor vehicles, non-industrial | 5,285 | 0.7 | 2,589 | 104.1 |
| 53. Transport equipment, parts and accessories | 32,116 | 4.1 | 24,473 | 31.2 |
| 6. Consumer goods not elsewhere specified | 196,597 | 24.9 | 154,499 | 27.2 |
| 61. Consumer goods not elsewhere specified, durable | 27,631 | 3.5 | 28,357 | -2.6 |
| 62. Consumer goods not elsewhere specified, semi-durable | 131,609 | 16.6 | 92,484 | 42.3 |
| 63. Consumer goods not elsewhere specified, non-durable | 37,356 | 4.7 | 33,658 | 11.0 |
| 7. Goods not elsewhere specified | 704 | 0.1 | 536 | 31.3 |
| All groups | 790,516 | 100.0 | 603,515 | 31.0 |
| Classification | Description | Year level | Quarter level | Month level | Year 2026 sofar |
|---|---|---|---|---|---|
| SITC | Standard International Trade Classification (classification system is maintained by the United Nations) | ███ | ███ | ███ | ███ |
| BEC | The standard of statistical classification of BEC (Broad Economic Categories) is upheld by the UN and it is based on SITC-nomenclature. | ███ | ███ | ███ | ███ |
| NACE | National industrial classification based on Statistical Classification of Economic Activities in the European Community Nomenclature générale des Activités économiques dans les Communautés européennes | ███ | ███ | ███ | ███ |
| CPA | CPA = Classification of Products by Activities | ███ | ███ | ███ | ███ |
| CN | The Combined Nomenclature is the common nomenclature of the European Community. | ███ | ███ | ███ | ███ |