
| Export of goods from Finland and import to Finland | Trade Balance |

| Import 1,000 € | Export 1,000 € | Trade 1,000 € | Trade Balance 1,000 € | |
|---|---|---|---|---|
| 2019 Q1 | 13,414 | 2,043 | 15,457 | -11,371 |
| 2019 Q2 | 12,416 | 1,813 | 14,229 | -10,603 |
| 2019 Q3 | 10,063 | 2,077 | 12,140 | -7,985 |
| 2019 Q4 | 8,911 | 2,080 | 10,991 | -6,831 |
| 2020 Q1 | 13,919 | 1,251 | 15,170 | -12,667 |
| 2020 Q2 | 13,155 | 3,793 | 16,948 | -9,361 |
| 2020 Q3 | 12,124 | 1,136 | 13,260 | -10,987 |
| 2020 Q4 | 11,514 | 2,094 | 13,608 | -9,420 |
| 2021 Q1 | 12,572 | 1,289 | 13,861 | -11,284 |
| 2021 Q2 | 12,138 | 1,989 | 14,127 | -10,148 |
| 2021 Q3 | 11,332 | 2,384 | 13,716 | -8,948 |
| 2021 Q4 | 9,761 | 3,477 | 13,239 | -6,284 |
| 2022 Q1 | 12,120 | 5,380 | 17,500 | -6,739 |
| 2022 Q2 | 13,438 | 6,751 | 20,189 | -6,687 |
| 2022 Q3 | 13,468 | 5,460 | 18,929 | -8,008 |
| 2022 Q4 | 11,169 | 3,062 | 14,232 | -8,107 |
| 2023 Q1 | 9,854 | 5,116 | 14,970 | -4,738 |
| 2023 Q2 | 11,351 | 3,600 | 14,952 | -7,751 |
| 2023 Q3 | 8,960 | 3,195 | 12,154 | -5,765 |
| 2023 Q4 | 6,990 | 4,144 | 11,134 | -2,846 |
| 2024 Q1 | 10,026 | 3,452 | 13,478 | -6,574 |
| 2024 Q2 | 11,097 | 2,461 | 13,558 | -8,636 |
| 2024 Q3 | 7,488 | 4,180 | 11,667 | -3,308 |
| 2024 Q4 | 8,173 | 3,914 | 12,088 | -4,259 |
| 2025 Q1 | 17,433 | 4,139 | 21,572 | -13,294 |
| 2025 Q2 | 7,592 | 5,868 | 13,460 | -1,724 |
| 2025 Q3 | 7,097 | 4,042 | 11,139 | -3,055 |
| 2025 Q4 | 10,990 | 8,799 | 19,789 | -2,191 |
| 2026 Q1 | 14,406 | 10,374 | 24,779 | -4,032 |
| 2026 Q2 | 14,306 | 15,559 | 29,865 | 1,252 |
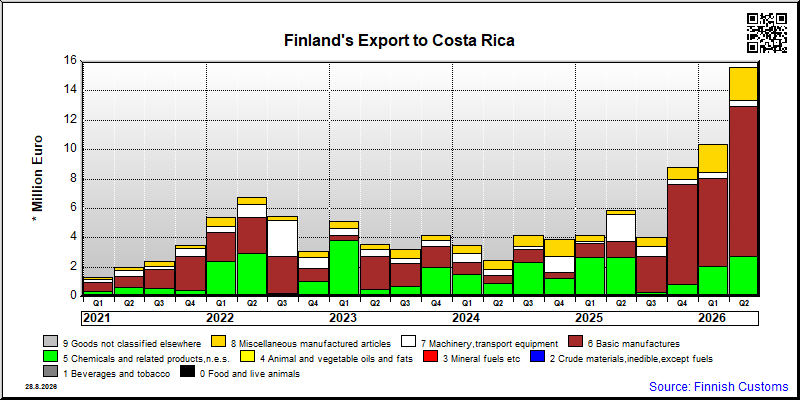
| Q2 / 2026 | Q2 / 2025 | Muutos edellisestä vastaavasta kaudesta % | ||
|---|---|---|---|---|
| 1,000 € | % | 1,000 € | ||
| 2. Crude materials,inedible,except fuels | 17 | 0.1 | 0 | .. |
| 5. Chemicals and related products,n.e.s. | 2,712 | 17.4 | 2,650 | 2.3 |
| 6. Basic manufactures | 10,183 | 65.4 | 1,069 | 852.4 |
| 7. Machinery,transport equipment | 418 | 2.7 | 1,856 | -77.5 |
| 8. Miscellaneous manufactured articles | 2,229 | 14.3 | 292 | 662.7 |
| All groups combined | 15,559 | 100.0 | 5,868 | 165.1 |

| Q2 / 2026 | Q2 / 2025 | Muutos edellisestä vastaavasta kaudesta % | ||
|---|---|---|---|---|
| 1,000 € | % | 1,000 € | ||
| 0. Food and live animals | 9,395 | 65.7 | 4,809 | 95.4 |
| 1. Beverages and tobacco | 0 | 0 | 0 | .. |
| 2. Crude materials,inedible,except fuels | 44 | 0.3 | 35 | 26.0 |
| 3. Mineral fuels etc | 1 | 0.0 | 0 | .. |
| 5. Chemicals and related products,n.e.s. | 422 | 2.9 | 112 | 276.3 |
| 6. Basic manufactures | 15 | 0.1 | 6 | 137.4 |
| 7. Machinery,transport equipment | 1,854 | 13.0 | 617 | 200.4 |
| 8. Miscellaneous manufactured articles | 2,576 | 18.0 | 1,997 | 29.0 |
| 9. Goods not classified elsewhere | 0 | 0.0 | 0 | -70.4 |
| All groups combined | 14,306 | 100.0 | 7,577 | 88.8 |
| Classification | Description | Year level | Quarter level | Month level | Year 2026 sofar |
|---|---|---|---|---|---|
| SITC | Standard International Trade Classification (classification system is maintained by the United Nations) | ███ | ███ | ███ | ███ |
| BEC | The standard of statistical classification of BEC (Broad Economic Categories) is upheld by the UN and it is based on SITC-nomenclature. | ███ | ███ | ███ | ███ |
| NACE | National industrial classification based on Statistical Classification of Economic Activities in the European Community Nomenclature générale des Activités économiques dans les Communautés européennes | ███ | ███ | ███ | ███ |
| CPA | CPA = Classification of Products by Activities | ███ | ███ | ███ | ███ |
| CN | The Combined Nomenclature is the common nomenclature of the European Community. | ███ | ███ | ███ | ███ |