
| Export of goods from Finland and import to Finland | Trade Balance |
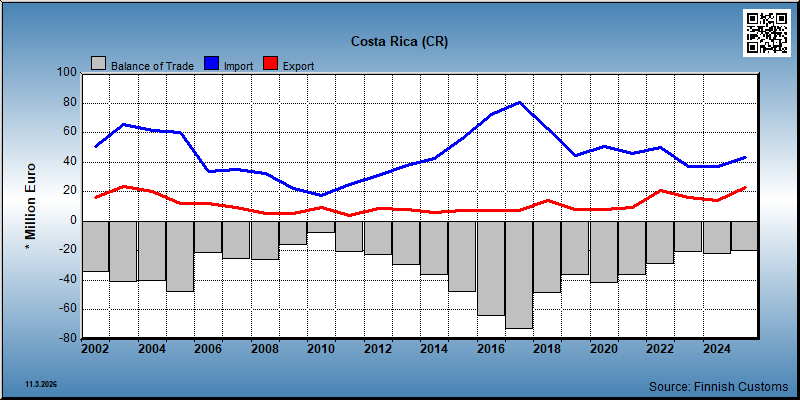
| Year | Import 1,000 € | Export 1,000 € | Trade 1,000 € | Trade balance 1,000 € |
|---|---|---|---|---|
| 2002 | 50,921 | 16,379 | 67,300 | -34,543 |
| 2003 | 65,170 | 23,756 | 88,926 | -41,414 |
| 2004 | 61,121 | 20,308 | 81,429 | -40,812 |
| 2005 | 60,265 | 11,996 | 72,261 | -48,268 |
| 2006 | 33,729 | 11,884 | 45,612 | -21,845 |
| 2007 | 34,836 | 9,237 | 44,073 | -25,600 |
| 2008 | 32,147 | 5,347 | 37,494 | -26,800 |
| 2009 | 21,931 | 5,312 | 27,243 | -16,620 |
| 2010 | 17,108 | 9,064 | 26,172 | -8,044 |
| 2011 | 25,187 | 3,872 | 29,059 | -21,315 |
| 2012 | 31,266 | 8,326 | 39,591 | -22,940 |
| 2013 | 37,646 | 7,793 | 45,439 | -29,853 |
| 2014 | 42,164 | 5,743 | 47,907 | -36,421 |
| 2015 | 55,686 | 7,523 | 63,209 | -48,163 |
| 2016 | 72,265 | 7,490 | 79,755 | -64,774 |
| 2017 | 80,690 | 7,476 | 88,166 | -73,214 |
| 2018 | 62,862 | 13,913 | 76,776 | -48,949 |
| 2019 | 44,804 | 8,013 | 52,817 | -36,790 |
| 2020 | 50,711 | 8,274 | 58,985 | -42,437 |
| 2021 | 45,804 | 9,139 | 54,943 | -36,664 |
| 2022 | 50,196 | 20,653 | 70,849 | -29,542 |
| 2023 | 37,155 | 16,055 | 53,210 | -21,100 |
| 2024 | 36,784 | 14,006 | 50,790 | -22,778 |
| 2025 | 43,115 | 22,848 | 65,963 | -20,267 |
*) SITC = Standard International Trade Classification (classification system is maintained by the United Nations)


| 2021 | 2022 | 2023 | 2024 | 2025 | ||||||
|---|---|---|---|---|---|---|---|---|---|---|
| 1,000 € | % | 1,000 € | % | 1,000 € | % | 1,000 € | % | 1,000 € | % | |
| 1. Beverages and tobacco | 38 | 0.4 | 44 | 0.2 | 61 | 0.4 | 61 | 0.4 | 57 | 0.3 |
| 11. Beverages | 38 | 0.4 | 44 | 0.2 | 61 | 0.4 | 61 | 0.4 | 57 | 0.3 |
| 2. Crude materials,inedible,except fuels | 41 | 0.3 | 67 | 0.3 | ||||||
| 24. Cork and wood | 41 | 0.3 | 67 | 0.3 | ||||||
| 5. Chemicals and related products,n.e.s. | 1,883 | 20.6 | 6,445 | 31.2 | 6,855 | 42.9 | 5,787 | 41.3 | 6,358 | 27.8 |
| 51. Organic chemicals | 34 | 0.4 | 1 | 0.0 | 1 | 0.0 | ||||
| 52. Inorganic chemicals | 1 | 0.0 | ||||||||
| 53. Dyeing,tanning and colouring material | 4 | 0.0 | 2 | 0.0 | ||||||
| 54. Medicinal and pharmaceutical products | 27 | 0.1 | 439 | 2.7 | 342 | 2.4 | 570 | 2.5 | ||
| 56. Fertilizers,manufactured | 721 | 7.9 | 5,113 | 24.8 | 4,596 | 28.7 | 2,689 | 19.2 | 4,401 | 19.3 |
| 57. Plastics in primary forms | 217 | 2.4 | 59 | 0.3 | ||||||
| 58. Plastics in non-primary forms | 383 | 4.2 | 810 | 3.9 | 1,263 | 7.9 | 2,268 | 16.2 | 799 | 3.5 |
| 59. Chemical materials and products,n.e.s. | 525 | 5.7 | 492 | 2.4 | 556 | 3.5 | 486 | 3.5 | 529 | 2.3 |
| 6. Basic manufactures | 5,065 | 55.4 | 7,943 | 38.5 | 5,583 | 34.9 | 2,652 | 18.9 | 11,162 | 48.9 |
| 62. Rubber manufactures,n.e.s. | 4 | 0.0 | 10 | 0.1 | 12 | 0.1 | 9 | 0.1 | 7 | 0.0 |
| 64. Paper,paperboard and articles thereof | 5,017 | 54.9 | 7,748 | 37.5 | 5,301 | 33.2 | 2,451 | 17.5 | 11,008 | 48.2 |
| 65. Textile yarn,fabrics,made up articles,etc. | 1 | 0.0 | 1 | 0.0 | 77 | 0.5 | 78 | 0.6 | 13 | 0.1 |
| 66. Non-metallic mineral manufactures,n.e.s. | 18 | 0.2 | 39 | 0.2 | 23 | 0.1 | 4 | 0.0 | 1 | 0.0 |
| 67. Iron and steel | 1 | 0.0 | 3 | 0.0 | 2 | 0.0 | 3 | 0.0 | ||
| 69. Manufactures of metals,n.e.s. | 24 | 0.3 | 142 | 0.7 | 169 | 1.1 | 109 | 0.8 | 130 | 0.6 |
| 7. Machinery,transport equipment | 1,273 | 13.9 | 4,460 | 21.6 | 1,715 | 10.7 | 2,383 | 17.0 | 3,089 | 13.5 |
| 71. Power generating machinery and equipment | 4 | 0.0 | 4 | 0.0 | 81 | 0.5 | 3 | 0.0 | 16 | 0.1 |
| 72. Machinery for specialized industries | 17 | 0.2 | 2,122 | 10.3 | 59 | 0.4 | 589 | 4.2 | 1,182 | 5.2 |
| 73. Metal working machinery | 62 | 0.7 | 40 | 0.2 | 28 | 0.2 | 88 | 0.6 | 87 | 0.4 |
| 74. General industrial machinery n.e.s. | 114 | 1.2 | 274 | 1.3 | 159 | 1.0 | 110 | 0.8 | 438 | 1.9 |
| 75. Office machines and adp machines | 5 | 0.1 | 12 | 0.1 | 19 | 0.1 | 23 | 0.2 | 14 | 0.1 |
| 76. Telecommunications and sound recording equipment | 67 | 0.7 | 25 | 0.1 | 107 | 0.7 | 93 | 0.7 | 78 | 0.3 |
| 77. Electric machinery,n.e.s.and parts | 1,004 | 11.0 | 1,979 | 9.6 | 1,262 | 7.9 | 1,477 | 10.5 | 788 | 3.4 |
| 78. Road vehicles | 2 | 0.0 | 5 | 0.0 | ||||||
| 79. Other transport equipment | 487 | 2.1 | ||||||||
| 8. Miscellaneous manufactured articles | 881 | 9.6 | 1,762 | 8.5 | 1,777 | 11.1 | 3,082 | 22.0 | 2,115 | 9.3 |
| 81. Prefabr.buildings;sanitary,lighting etc.fixtrs | 53 | 0.6 | 47 | 0.2 | 58 | 0.4 | 2 | 0.0 | ||
| 82. Furniture and parts thereof | 2 | 0.0 | 1 | 0.0 | 2 | 0.0 | 532 | 2.3 | ||
| 83. Travel goods,handbags and sim.containers | 2 | 0.0 | ||||||||
| 84. Articles of apparel and clothing accessories | 2 | 0.0 | 3 | 0.0 | 6 | 0.0 | 5 | 0.0 | 4 | 0.0 |
| 85. Footwear | 1 | 0.0 | 5 | 0.0 | ||||||
| 87. Instruments and apparates n.e.s. | 599 | 6.5 | 811 | 3.9 | 884 | 5.5 | 2,117 | 15.1 | 1,520 | 6.7 |
| 88. Photographic equipment,optical goods etc. | 11 | 0.1 | 6 | 0.0 | 7 | 0.0 | ||||
| 89. Miscellaneous manufactured articles,n.e.s. | 212 | 2.3 | 894 | 4.3 | 822 | 5.1 | 956 | 6.8 | 52 | 0.2 |
| All groups combined | 9,139 | 100.0 | 20,655 | 100.0 | 15,990 | 100.0 | 14,006 | 100.0 | 22,848 | 100.0 |

| 2021 | 2022 | 2023 | 2024 | 2025 | ||||||
|---|---|---|---|---|---|---|---|---|---|---|
| 1,000 € | % | 1,000 € | % | 1,000 € | % | 1,000 € | % | 1,000 € | % | |
| 0. Food and live animals | 37,106 | 81.9 | 35,950 | 77.8 | 25,464 | 70.6 | 15,746 | 61.0 | 33,344 | 77.4 |
| 00. Live animals | 1 | 0.0 | ||||||||
| 03. Fish and fish preparations | 1 | 0.0 | ||||||||
| 05. Vegetables and fruit | 35,599 | 78.6 | 33,871 | 73.3 | 22,278 | 61.8 | 11,295 | 43.7 | 19,578 | 45.4 |
| 07. Coffee,tea,cocoa,spices | 955 | 2.1 | 1,458 | 3.2 | 2,666 | 7.4 | 3,817 | 14.8 | 13,183 | 30.6 |
| 09. Miscellaneous edible products and preparations | 552 | 1.2 | 621 | 1.3 | 519 | 1.4 | 635 | 2.5 | 583 | 1.4 |
| 2. Crude materials,inedible,except fuels | 128 | 0.3 | 324 | 0.7 | 282 | 0.8 | 209 | 0.8 | 162 | 0.4 |
| 24. Cork and wood | 30 | 0.1 | ||||||||
| 29. Crude animal,vegetable materials n.e.s. | 128 | 0.3 | 294 | 0.6 | 282 | 0.8 | 209 | 0.8 | 162 | 0.4 |
| 5. Chemicals and related products,n.e.s. | 191 | 0.4 | 339 | 0.7 | 433 | 1.2 | 475 | 1.8 | 444 | 1.0 |
| 54. Medicinal and pharmaceutical products | 180 | 0.4 | 314 | 0.7 | 424 | 1.2 | 414 | 1.6 | 324 | 0.8 |
| 55. Perfume,cleaning etc.preparations | 5 | 0.0 | 20 | 0.0 | 5 | 0.0 | 2 | 0.0 | 12 | 0.0 |
| 58. Plastics in non-primary forms | 5 | 0.0 | 4 | 0.0 | 5 | 0.0 | 27 | 0.1 | 75 | 0.2 |
| 59. Chemical materials and products,n.e.s. | 2 | 0.0 | 1 | 0.0 | 32 | 0.1 | 34 | 0.1 | ||
| 6. Basic manufactures | 40 | 0.1 | 11 | 0.0 | 13 | 0.0 | 11 | 0.0 | 31 | 0.1 |
| 62. Rubber manufactures,n.e.s. | 11 | 0.0 | 2 | 0.0 | 3 | 0.0 | 2 | 0.0 | 26 | 0.1 |
| 63. Wood and cork manufactures | 1 | 0.0 | 2 | 0.0 | ||||||
| 65. Textile yarn,fabrics,made up articles,etc. | 1 | 0.0 | 4 | 0.0 | 4 | 0.0 | 3 | 0.0 | ||
| 66. Non-metallic mineral manufactures,n.e.s. | 4 | 0.0 | ||||||||
| 69. Manufactures of metals,n.e.s. | 28 | 0.1 | 4 | 0.0 | 9 | 0.0 | 1 | 0.0 | 1 | 0.0 |
| 7. Machinery,transport equipment | 1,509 | 3.3 | 4,186 | 9.1 | 3,411 | 9.5 | 1,616 | 6.3 | 2,345 | 5.4 |
| 71. Power generating machinery and equipment | 1 | 0.0 | 2 | 0.0 | ||||||
| 72. Machinery for specialized industries | 13 | 0.0 | 5 | 0.0 | 13 | 0.0 | 34 | 0.1 | ||
| 73. Metal working machinery | 8 | 0.0 | 7 | 0.0 | 3 | 0.0 | 3 | 0.0 | 6 | 0.0 |
| 74. General industrial machinery n.e.s. | 1 | 0.0 | 1 | 0.0 | 5 | 0.0 | 8 | 0.0 | ||
| 75. Office machines and adp machines | 1 | 0.0 | 27 | 0.1 | 1 | 0.0 | ||||
| 76. Telecommunications and sound recording equipment | 23 | 0.1 | 90 | 0.2 | 107 | 0.3 | 248 | 1.0 | 15 | 0.0 |
| 77. Electric machinery,n.e.s.and parts | 1,475 | 3.3 | 4,046 | 8.8 | 3,286 | 9.1 | 1,350 | 5.2 | 2,277 | 5.3 |
| 78. Road vehicles | 1 | 0.0 | 2 | 0.0 | 6 | 0.0 | ||||
| 8. Miscellaneous manufactured articles | 5,560 | 12.3 | 5,328 | 11.5 | 6,458 | 17.9 | 7,762 | 30.1 | 6,765 | 15.7 |
| 81. Prefabr.buildings;sanitary,lighting etc.fixtrs | 1 | 0.0 | ||||||||
| 84. Articles of apparel and clothing accessories | 208 | 0.5 | 117 | 0.3 | 124 | 0.3 | 114 | 0.4 | 3 | 0.0 |
| 85. Footwear | 2 | 0.0 | 2 | 0.0 | ||||||
| 87. Instruments and apparates n.e.s. | 4,252 | 9.4 | 3,945 | 8.5 | 4,599 | 12.8 | 5,898 | 22.8 | 4,422 | 10.3 |
| 88. Photographic equipment,optical goods etc. | 107 | 0.2 | 63 | 0.1 | 2 | 0.0 | ||||
| 89. Miscellaneous manufactured articles,n.e.s. | 993 | 2.2 | 1,199 | 2.6 | 1,732 | 4.8 | 1,751 | 6.8 | 2,341 | 5.4 |
| 9. Goods not classified elsewhere | 765 | 1.7 | 105 | 0.2 | 1 | 0.0 | 1 | 0.0 | 2 | 0.0 |
| 93. Special transactions and commodities not classified | 765 | 1.7 | 105 | 0.2 | 1 | 0.0 | 1 | 0.0 | 2 | 0.0 |
| All groups combined | 45,299 | 100.0 | 46,228 | 100.0 | 36,063 | 100.0 | 25,821 | 100.0 | 43,093 | 100.0 |
| Classification | Description | Year level | Quarter level | Month level | |
|---|---|---|---|---|---|
| SITC | Standard International Trade Classification (classification system is maintained by the United Nations) | ███ | ███ | ███ | |
| BEC | The standard of statistical classification of BEC (Broad Economic Categories) is upheld by the UN and it is based on SITC-nomenclature. | ███ | ███ | ███ | |
| NACE | National industrial classification based on Statistical Classification of Economic Activities in the European Community Nomenclature générale des Activités économiques dans les Communautés européennes | ███ | ███ | ███ | |
| CPA | CPA = Classification of Products by Activities | ███ | ███ | ███ | |
| CN | The Combined Nomenclature is the common nomenclature of the European Community. | ███ | ███ | ███ |