
| Export of goods from Finland and import to Finland | Trade Balance |

| Import 1,000 € | Export 1,000 € | Trade 1,000 € | Trade Balance 1,000 € | |
|---|---|---|---|---|
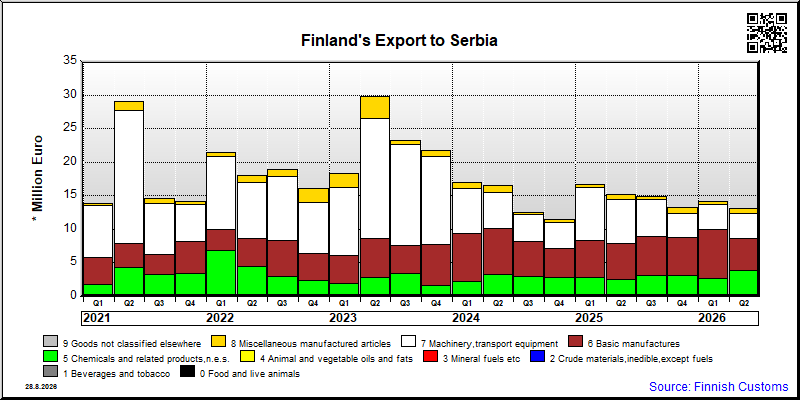
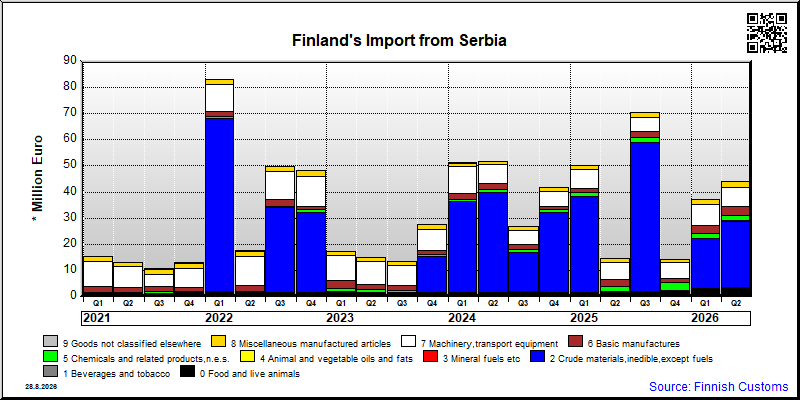
| 2019 Q1 | 12,121 | 10,210 | 22,331 | -1,911 |
| 2019 Q2 | 7,633 | 7,759 | 15,391 | 126 |
| 2019 Q3 | 8,172 | 8,314 | 16,486 | 141 |
| 2019 Q4 | 6,252 | 8,586 | 14,838 | 2,334 |
| 2020 Q1 | 11,207 | 12,607 | 23,814 | 1,400 |
| 2020 Q2 | 7,425 | 15,570 | 22,996 | 8,145 |
| 2020 Q3 | 9,459 | 11,355 | 20,813 | 1,896 |
| 2020 Q4 | 10,568 | 16,845 | 27,413 | 6,276 |
| 2021 Q1 | 15,243 | 13,794 | 29,037 | -1,449 |
| 2021 Q2 | 12,986 | 29,079 | 42,065 | 16,093 |
| 2021 Q3 | 10,585 | 14,599 | 25,183 | 4,014 |
| 2021 Q4 | 13,061 | 14,115 | 27,176 | 1,054 |
| 2022 Q1 | 86,852 | 21,492 | 108,343 | -65,360 |
| 2022 Q2 | 17,429 | 18,032 | 35,460 | 603 |
| 2022 Q3 | 49,266 | 18,985 | 68,251 | -30,282 |
| 2022 Q4 | 48,479 | 16,022 | 64,501 | -32,457 |
| 2023 Q1 | 32,528 | 18,270 | 50,799 | -14,258 |
| 2023 Q2 | 15,055 | 29,999 | 45,054 | 14,944 |
| 2023 Q3 | 13,260 | 23,258 | 36,519 | 9,998 |
| 2023 Q4 | 27,646 | 21,742 | 49,388 | -5,904 |
| 2024 Q1 | 52,140 | 17,017 | 69,156 | -35,123 |
| 2024 Q2 | 50,363 | 16,499 | 66,862 | -33,864 |
| 2024 Q3 | 26,525 | 12,538 | 39,063 | -13,987 |
| 2024 Q4 | 41,386 | 11,451 | 52,838 | -29,935 |
| 2025 Q1 | 50,069 | 16,803 | 66,872 | -33,266 |
| 2025 Q2 | 14,674 | 15,241 | 29,914 | 567 |
| 2025 Q3 | 70,383 | 14,842 | 85,225 | -55,541 |
| 2025 Q4 | 14,371 | 13,116 | 27,487 | -1,254 |
| 2026 Q1 | 41,048 | 14,109 | 55,157 | -26,939 |
| 2026 Q2 | 43,962 | 13,135 | 57,096 | -30,827 |
| Q2 / 2026 | Q2 / 2025 | Muutos edellisestä vastaavasta kaudesta % | ||
|---|---|---|---|---|
| 1,000 € | % | 1,000 € | ||
| 0. Food and live animals | 31 | 0.2 | 80 | -61.0 |
| 1. Beverages and tobacco | 149 | 1.1 | 0 | .. |
| 2. Crude materials,inedible,except fuels | 107 | 0.8 | 14 | 680.7 |
| 3. Mineral fuels etc | 1 | 0.0 | 0 | .. |
| 5. Chemicals and related products,n.e.s. | 3,554 | 27.1 | 2,424 | 46.7 |
| 6. Basic manufactures | 4,747 | 36.1 | 5,414 | -12.3 |
| 7. Machinery,transport equipment | 3,763 | 28.7 | 6,456 | -41.7 |
| 8. Miscellaneous manufactured articles | 782 | 6.0 | 854 | -8.4 |
| All groups combined | 13,135 | 100.0 | 15,241 | -13.8 |
| Q2 / 2026 | Q2 / 2025 | Muutos edellisestä vastaavasta kaudesta % | ||
|---|---|---|---|---|
| 1,000 € | % | 1,000 € | ||
| 0. Food and live animals | 3,445 | 7.8 | 2,021 | 70.5 |
| 1. Beverages and tobacco | 16 | 0.0 | 33 | -51.0 |
| 2. Crude materials,inedible,except fuels | 25,137 | 57.2 | 3 | .. |
| 3. Mineral fuels etc | 385 | 0.9 | 0 | .. |
| 4. Animal and vegetable oils and fats | 0 | 0 | 0 | .. |
| 5. Chemicals and related products,n.e.s. | 2,091 | 4.8 | 1,699 | 23.1 |
| 6. Basic manufactures | 3,342 | 7.6 | 2,697 | 23.9 |
| 7. Machinery,transport equipment | 7,339 | 16.7 | 6,631 | 10.7 |
| 8. Miscellaneous manufactured articles | 2,199 | 5.0 | 1,586 | 38.7 |
| 9. Goods not classified elsewhere | 8 | 0.0 | 8 | -6.5 |
| All groups combined | 43,962 | 100.0 | 14,677 | 199.5 |
| Classification | Description | Year level | Quarter level | Month level | Year 2026 sofar |
|---|---|---|---|---|---|
| SITC | Standard International Trade Classification (classification system is maintained by the United Nations) | ███ | ███ | ███ | ███ |
| BEC | The standard of statistical classification of BEC (Broad Economic Categories) is upheld by the UN and it is based on SITC-nomenclature. | ███ | ███ | ███ | ███ |
| NACE | National industrial classification based on Statistical Classification of Economic Activities in the European Community Nomenclature générale des Activités économiques dans les Communautés européennes | ███ | ███ | ███ | ███ |
| CPA | CPA = Classification of Products by Activities | ███ | ███ | ███ | ███ |
| CN | The Combined Nomenclature is the common nomenclature of the European Community. | ███ | ███ | ███ | ███ |