
| Export of goods from Finland and import to Finland | Trade Balance |
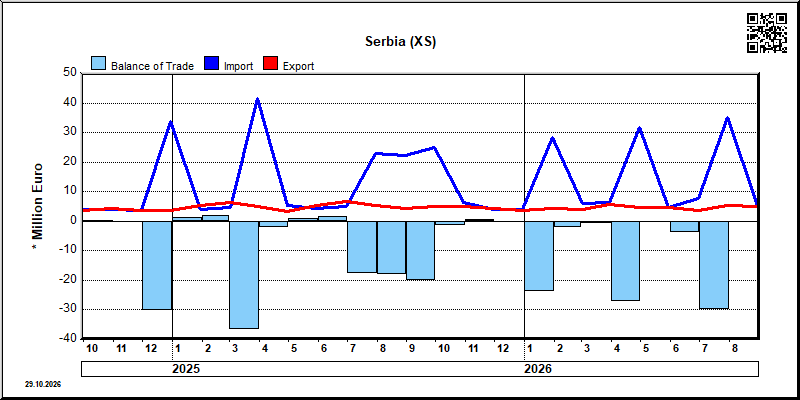
| Year | Month | Import 1,000 € | Export 1,000 € | Trade 1,000 € | Trade Balance 1,000 € |
|---|---|---|---|---|---|
| 2023 | 1 | 19,501 | 4,956 | 24,457 | -14,544 |
| 2023 | 2 | 4,892 | 4,254 | 9,147 | -638 |
| 2023 | 3 | 8,135 | 9,060 | 17,195 | 925 |
| 2023 | 4 | 5,130 | 9,787 | 14,916 | 4,657 |
| 2023 | 5 | 5,423 | 11,253 | 16,676 | 5,829 |
| 2023 | 6 | 4,502 | 8,960 | 13,462 | 4,457 |
| 2023 | 7 | 4,525 | 7,364 | 11,890 | 2,839 |
| 2023 | 8 | 3,905 | 9,938 | 13,843 | 6,033 |
| 2023 | 9 | 4,830 | 5,956 | 10,786 | 1,125 |
| 2023 | 10 | 4,830 | 4,851 | 9,681 | 22 |
| 2023 | 11 | 4,981 | 10,962 | 15,943 | 5,981 |
| 2023 | 12 | 17,835 | 5,928 | 23,763 | -11,907 |
| 2024 | 1 | 14,996 | 7,048 | 22,045 | -7,948 |
| 2024 | 2 | 33,035 | 4,865 | 37,900 | -28,170 |
| 2024 | 3 | 4,109 | 5,103 | 9,212 | 995 |
| 2024 | 4 | 5,681 | 5,663 | 11,345 | -18 |
| 2024 | 5 | 28,507 | 6,405 | 34,911 | -22,102 |
| 2024 | 6 | 16,175 | 4,431 | 20,606 | -11,744 |
| 2024 | 7 | 3,983 | 4,243 | 8,226 | 260 |
| 2024 | 8 | 18,723 | 4,675 | 23,398 | -14,048 |
| 2024 | 9 | 3,819 | 3,620 | 7,439 | -199 |
| 2024 | 10 | 3,998 | 4,246 | 8,244 | 249 |
| 2024 | 11 | 3,678 | 3,530 | 7,208 | -148 |
| 2024 | 12 | 33,711 | 3,675 | 37,386 | -30,036 |
| 2025 | 1 | 3,860 | 5,230 | 9,091 | 1,370 |
| 2025 | 2 | 4,499 | 6,428 | 10,927 | 1,928 |
| 2025 | 3 | 41,709 | 5,145 | 46,854 | -36,564 |
| 2025 | 4 | 5,329 | 3,178 | 8,507 | -2,151 |
| 2025 | 5 | 4,209 | 5,238 | 9,447 | 1,029 |
| 2025 | 6 | 5,136 | 6,824 | 11,960 | 1,689 |
| 2025 | 7 | 23,078 | 5,506 | 28,584 | -17,573 |
| 2025 | 8 | 22,321 | 4,276 | 26,597 | -18,045 |
| 2025 | 9 | 24,984 | 5,060 | 30,044 | -19,924 |
| 2025 | 10 | 6,467 | 4,927 | 11,395 | -1,540 |
| 2025 | 11 | 3,838 | 4,468 | 8,306 | 630 |
| 2025 | 12 | 4,065 | 3,721 | 7,786 | -344 |
| 2026 | 1 | 28,178 | 4,287 | 32,465 | -23,892 |
| 2026 | 2 | 6,173 | 4,076 | 10,249 | -2,097 |
| 2026 | 3 | 6,500 | 5,673 | 12,172 | -827 |
| 2026 | 4 | 31,574 | 4,577 | 36,151 | -26,998 |
| 2026 | 5 | 4,772 | 4,669 | 9,441 | -103 |
| 2026 | 6 | 7,575 | 3,756 | 11,331 | -3,820 |
| 2026 | 7 | 35,057 | 5,253 | 40,310 | -29,805 |
| 2026 | 8 | 5,464 | 5,065 | 10,529 | -399 |

| 2026/4 | 2026/5 | 2026/6 | 2026/7 | 2026/8 | ||||||
|---|---|---|---|---|---|---|---|---|---|---|
| 1000 € | % | 1000 € | % | 1000 € | % | 1000 € | % | 1000 € | % | |
| 0. Food and live animals | 11 | 0.2 | 9 | 0.2 | 11 | 0.3 | 49 | 0.9 | 48 | 0.9 |
| 1. Beverages and tobacco | 84 | 1.8 | 61 | 1.6 | 51 | 1.0 | 77 | 1.5 | ||
| 2. Crude materials,inedible,except fuels | 14 | 0.3 | 68 | 1.5 | 25 | 0.7 | 27 | 0.5 | 31 | 0.6 |
| 3. Mineral fuels etc | 1 | 0.0 | ||||||||
| 5. Chemicals and related products,n.e.s. | 774 | 16.9 | 1,512 | 32.4 | 1,240 | 33.0 | 1,353 | 25.8 | 1,324 | 26.1 |
| 6. Basic manufactures | 2,143 | 46.8 | 1,343 | 28.8 | 1,261 | 33.6 | 2,413 | 45.9 | 1,958 | 38.7 |
| 7. Machinery,transport equipment | 1,477 | 32.3 | 1,485 | 31.8 | 698 | 18.6 | 1,171 | 22.3 | 1,376 | 27.2 |
| 8. Miscellaneous manufactured articles | 73 | 1.6 | 251 | 5.4 | 458 | 12.2 | 188 | 3.6 | 250 | 4.9 |
| All groups combined | 4,577 | 100.0 | 4,669 | 100.0 | 3,756 | 100.0 | 5,253 | 100.0 | 5,065 | 100.0 |
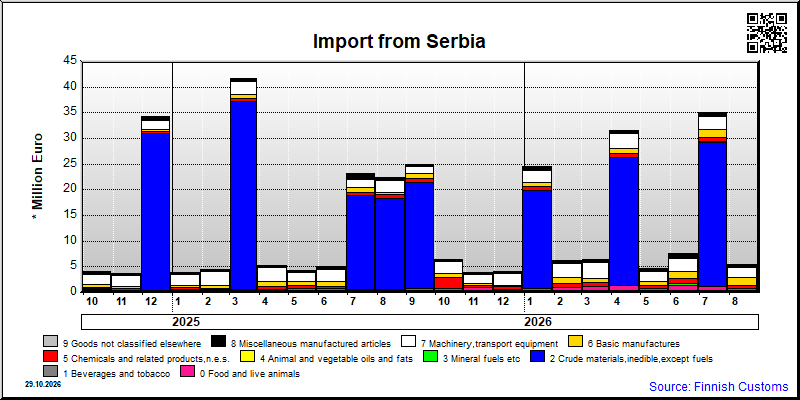
| 2026/4 | 2026/5 | 2026/6 | 2026/7 | 2026/8 | ||||||
|---|---|---|---|---|---|---|---|---|---|---|
| 1000 € | % | 1000 € | % | 1000 € | % | 1000 € | % | 1000 € | % | |
| 0. Food and live animals | 1,270 | 4.0 | 735 | 15.4 | 1,424 | 18.8 | 1,153 | 3.3 | 771 | 14.1 |
| 1. Beverages and tobacco | 15 | 0.3 | 1 | 0.0 | 2 | 0.0 | 13 | 0.2 | ||
| 2. Crude materials,inedible,except fuels | 25,123 | 79.6 | 5 | 0.1 | 28,035 | 80.0 | 2 | 0.0 | ||
| 3. Mineral fuels etc | 385 | 5.1 | 274 | 0.8 | ||||||
| 5. Chemicals and related products,n.e.s. | 685 | 2.2 | 539 | 11.3 | 824 | 10.9 | 707 | 2.0 | 670 | 12.3 |
| 6. Basic manufactures | 1,046 | 3.3 | 906 | 19.0 | 1,434 | 18.9 | 1,669 | 4.8 | 1,518 | 27.8 |
| 7. Machinery,transport equipment | 2,889 | 9.2 | 1,875 | 39.3 | 2,640 | 34.9 | 2,389 | 6.8 | 1,955 | 35.8 |
| 8. Miscellaneous manufactured articles | 557 | 1.8 | 694 | 14.5 | 865 | 11.4 | 827 | 2.4 | 534 | 9.8 |
| 9. Goods not classified elsewhere | 3 | 0.0 | 2 | 0.1 | 2 | 0.0 | 2 | 0.0 | 2 | 0.0 |
| All groups combined | 31,574 | 100.0 | 4,772 | 100.0 | 7,575 | 100.0 | 35,057 | 100.0 | 5,464 | 100.0 |
| Classification | Description | Year level | Quarter level | Month level | Year 2026 sofar |
|---|---|---|---|---|---|
| SITC | Standard International Trade Classification (classification system is maintained by the United Nations) | ███ | ███ | ███ | ███ |
| BEC | The standard of statistical classification of BEC (Broad Economic Categories) is upheld by the UN and it is based on SITC-nomenclature. | ███ | ███ | ███ | ███ |
| NACE | National industrial classification based on Statistical Classification of Economic Activities in the European Community Nomenclature générale des Activités économiques dans les Communautés européennes | ███ | ███ | ███ | ███ |
| CPA | CPA = Classification of Products by Activities | ███ | ███ | ███ | ███ |
| CN | The Combined Nomenclature is the common nomenclature of the European Community. | ███ | ███ | ███ | ███ |