
| Export of goods from Finland and import to Finland | SITC (Standard International Trade Classification) |
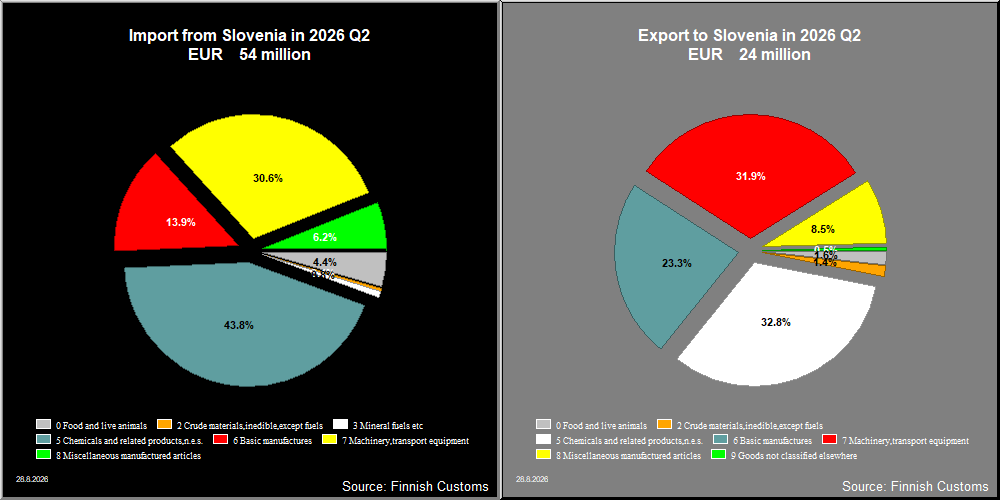

| Q2 / 2026 | Q2 / 2025 | Muutos edellisestä vastaavasta kaudesta % | ||
|---|---|---|---|---|
| 1,000 € | % | 1,000 € | ||
| 0. Food and live animals | 386 | 1.6 | 334 | 15.6 |
| 04. Cereals and cereal preparations | 10 | 0.0 | 7 | 52.2 |
| 05. Vegetables and fruit | 0 | 0 | 1 | .. |
| 06. Sugars,sugar preparations and honey | 1 | 0.0 | 0 | .. |
| 07. Coffee,tea,cocoa,spices | 60 | 0.3 | 78 | -22.1 |
| 08. Feeding stuff for animals | 7 | 0.0 | 1 | 485.8 |
| 09. Miscellaneous edible products and preparations | 307 | 1.3 | 248 | 23.8 |
| 1. Beverages and tobacco | 12 | 0.1 | 4 | 238.4 |
| 11. Beverages | 12 | 0.1 | 4 | 238.4 |
| 2. Crude materials,inedible,except fuels | 346 | 1.4 | 129 | 167.6 |
| 23. Crude rubber (incl.synthetic) | 0 | 0.0 | 0 | -84.6 |
| 24. Cork and wood | 237 | 1.0 | 122 | 94.4 |
| 27. Crude fertilizers and crude minerals | 101 | 0.4 | 1 | .. |
| 29. Crude animal,vegetable materials n.e.s. | 7 | 0.0 | 6 | 17.8 |
| 3. Mineral fuels etc | 5 | 0.0 | 1 | 625.2 |
| 33. Petroleum and products | 5 | 0.0 | 1 | 625.2 |
| 4. Animal and vegetable oils and fats | 0 | 0.0 | 0 | 42.9 |
| 42. Fixed vegetable fats and oils | 0 | 0.0 | 0 | 42.9 |
| 5. Chemicals and related products,n.e.s. | 7,881 | 32.8 | 2,998 | 162.8 |
| 51. Organic chemicals | 2 | 0.0 | 0 | .. |
| 52. Inorganic chemicals | 4 | 0.0 | 0 | .. |
| 53. Dyeing,tanning and colouring material | 8 | 0.0 | 141 | -94.7 |
| 54. Medicinal and pharmaceutical products | 5,998 | 25.0 | 1,408 | 326.1 |
| 55. Perfume,cleaning etc.preparations | 14 | 0.1 | 7 | 113.4 |
| 57. Plastics in primary forms | 1,233 | 5.1 | 662 | 86.2 |
| 58. Plastics in non-primary forms | 356 | 1.5 | 423 | -15.9 |
| 59. Chemical materials and products,n.e.s. | 266 | 1.1 | 358 | -25.6 |
| 6. Basic manufactures | 5,599 | 23.3 | 6,489 | -13.7 |
| 61. Leather,dressed fur,etc. | 12 | 0.1 | 6 | 114.6 |
| 62. Rubber manufactures,n.e.s. | 21 | 0.1 | 15 | 40.1 |
| 63. Wood and cork manufactures | 12 | 0.1 | 20 | -38.4 |
| 64. Paper,paperboard and articles thereof | 624 | 2.6 | 133 | 369.2 |
| 65. Textile yarn,fabrics,made up articles,etc. | 87 | 0.4 | 168 | -48.0 |
| 66. Non-metallic mineral manufactures,n.e.s. | 1,070 | 4.5 | 1,008 | 6.2 |
| 67. Iron and steel | 1,617 | 6.7 | 3,065 | -47.2 |
| 68. Non-ferrous metals | 622 | 2.6 | 301 | 106.7 |
| 69. Manufactures of metals,n.e.s. | 1,534 | 6.4 | 1,775 | -13.5 |
| 7. Machinery,transport equipment | 7,648 | 31.8 | 10,567 | -27.6 |
| 71. Power generating machinery and equipment | 648 | 2.7 | 194 | 233.9 |
| 72. Machinery for specialized industries | 1,708 | 7.1 | 5,735 | -70.2 |
| 73. Metal working machinery | 109 | 0.5 | 155 | -29.7 |
| 74. General industrial machinery n.e.s. | 1,960 | 8.2 | 704 | 178.4 |
| 75. Office machines and adp machines | 51 | 0.2 | 68 | -25.6 |
| 76. Telecommunications and sound recording equipment | 496 | 2.1 | 443 | 11.9 |
| 77. Electric machinery,n.e.s.and parts | 1,126 | 4.7 | 2,063 | -45.4 |
| 78. Road vehicles | 1,130 | 4.7 | 1,089 | 3.8 |
| 79. Other transport equipment | 420 | 1.7 | 115 | 265.5 |
| 8. Miscellaneous manufactured articles | 2,042 | 8.5 | 1,837 | 11.1 |
| 81. Prefabr.buildings;sanitary,lighting etc.fixtrs | 67 | 0.3 | 75 | -10.7 |
| 82. Furniture and parts thereof | 78 | 0.3 | 97 | -19.5 |
| 83. Travel goods,handbags and sim.containers | 2 | 0.0 | 4 | -53.0 |
| 84. Articles of apparel and clothing accessories | 259 | 1.1 | 160 | 62.3 |
| 85. Footwear | 92 | 0.4 | 169 | -45.3 |
| 87. Instruments and apparates n.e.s. | 1,148 | 4.8 | 1,082 | 6.2 |
| 88. Photographic equipment,optical goods etc. | 18 | 0.1 | 16 | 13.7 |
| 89. Miscellaneous manufactured articles,n.e.s. | 377 | 1.6 | 236 | 60.0 |
| 9. Goods not classified elsewhere | 110 | 0.5 | 78 | 40.8 |
| 93. Special transactions and commodities not classified | 110 | 0.5 | 73 | 50.7 |
| 96. Coin (not gold coin or legal) | 0 | 0 | 5 | .. |
| All groups combined | 24,029 | 100.0 | 22,437 | 7.1 |
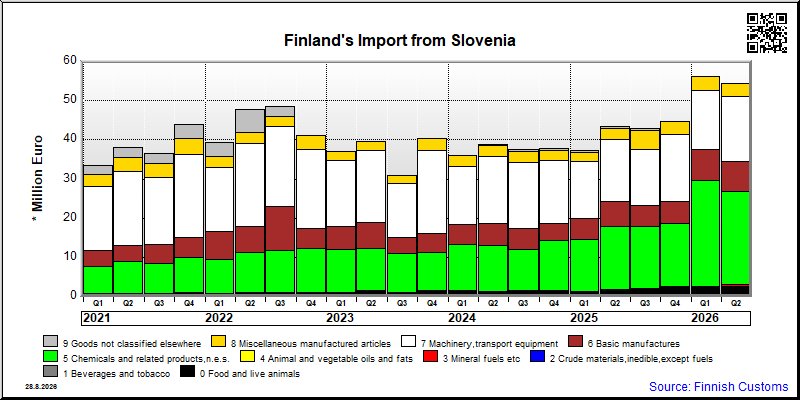
| Q2 / 2026 | Q2 / 2025 | Muutos edellisestä vastaavasta kaudesta % | ||
|---|---|---|---|---|
| 1,000 € | % | 1,000 € | ||
| 0. Food and live animals | 2,413 | 4.4 | 1,640 | 47.1 |
| 01. Meat and meat preparations | 28 | 0.1 | 0 | .. |
| 02. Dairy products and birds' eggs | 1,960 | 3.6 | 1,423 | 37.8 |
| 03. Fish and fish preparations | 1 | 0.0 | 0 | .. |
| 04. Cereals and cereal preparations | 151 | 0.3 | 122 | 23.8 |
| 05. Vegetables and fruit | 11 | 0.0 | 0 | .. |
| 06. Sugars,sugar preparations and honey | 6 | 0.0 | 0 | .. |
| 07. Coffee,tea,cocoa,spices | 20 | 0.0 | 11 | 85.7 |
| 08. Feeding stuff for animals | 19 | 0.0 | 9 | 101.3 |
| 09. Miscellaneous edible products and preparations | 218 | 0.4 | 75 | 189.2 |
| 1. Beverages and tobacco | 8 | 0.0 | 5 | 62.2 |
| 11. Beverages | 8 | 0.0 | 5 | 62.2 |
| 2. Crude materials,inedible,except fuels | 205 | 0.4 | 150 | 36.6 |
| 22. Oil seeds,oleaginous fruits | 0 | 0.0 | 0 | .. |
| 23. Crude rubber (incl.synthetic) | 0 | 0.0 | 21 | -100.0 |
| 26. Textile fibres and their wastes | 5 | 0.0 | 1 | 226.2 |
| 28. Metalliferous ores and metal scrap | 195 | 0.4 | 128 | 52.4 |
| 29. Crude animal,vegetable materials n.e.s. | 5 | 0.0 | 0 | .. |
| 3. Mineral fuels etc | 420 | 0.8 | 0 | .. |
| 33. Petroleum and products | 420 | 0.8 | 0 | .. |
| 34. Gas,natural and manufactured | 1 | 0.0 | 0 | .. |
| 4. Animal and vegetable oils and fats | 0 | 0.0 | 0 | .. |
| 42. Fixed vegetable fats and oils | 0 | 0.0 | 0 | .. |
| 5. Chemicals and related products,n.e.s. | 23,813 | 43.7 | 16,018 | 48.7 |
| 51. Organic chemicals | 1 | 0.0 | 5 | -74.7 |
| 52. Inorganic chemicals | 54 | 0.1 | 18 | 205.2 |
| 53. Dyeing,tanning and colouring material | 496 | 0.9 | 465 | 6.7 |
| 54. Medicinal and pharmaceutical products | 20,662 | 37.9 | 12,973 | 59.3 |
| 55. Perfume,cleaning etc.preparations | 1,000 | 1.8 | 732 | 36.7 |
| 56. Fertilizers,manufactured | 38 | 0.1 | 0 | .. |
| 57. Plastics in primary forms | 166 | 0.3 | 256 | -35.1 |
| 58. Plastics in non-primary forms | 1,127 | 2.1 | 921 | 22.4 |
| 59. Chemical materials and products,n.e.s. | 269 | 0.5 | 649 | -58.5 |
| 6. Basic manufactures | 7,589 | 13.9 | 6,556 | 15.8 |
| 61. Leather,dressed fur,etc. | 0 | 0.0 | 0 | .. |
| 62. Rubber manufactures,n.e.s. | 654 | 1.2 | 523 | 24.9 |
| 63. Wood and cork manufactures | 480 | 0.9 | 471 | 2.0 |
| 64. Paper,paperboard and articles thereof | 85 | 0.2 | 180 | -52.8 |
| 65. Textile yarn,fabrics,made up articles,etc. | 586 | 1.1 | 340 | 72.4 |
| 66. Non-metallic mineral manufactures,n.e.s. | 543 | 1.0 | 786 | -31.0 |
| 67. Iron and steel | 2,054 | 3.8 | 2,483 | -17.3 |
| 68. Non-ferrous metals | 1,178 | 2.2 | 759 | 55.4 |
| 69. Manufactures of metals,n.e.s. | 2,008 | 3.7 | 1,013 | 98.3 |
| 7. Machinery,transport equipment | 16,626 | 30.5 | 15,588 | 6.7 |
| 71. Power generating machinery and equipment | 4,095 | 7.5 | 523 | 682.4 |
| 72. Machinery for specialized industries | 785 | 1.4 | 883 | -11.1 |
| 73. Metal working machinery | 155 | 0.3 | 477 | -67.6 |
| 74. General industrial machinery n.e.s. | 4,221 | 7.7 | 2,373 | 77.9 |
| 75. Office machines and adp machines | 54 | 0.1 | 18 | 192.4 |
| 76. Telecommunications and sound recording equipment | 311 | 0.6 | 409 | -24.0 |
| 77. Electric machinery,n.e.s.and parts | 5,143 | 9.4 | 6,375 | -19.3 |
| 78. Road vehicles | 1,657 | 3.0 | 4,528 | -63.4 |
| 79. Other transport equipment | 204 | 0.4 | 1 | .. |
| 8. Miscellaneous manufactured articles | 3,356 | 6.2 | 3,013 | 11.4 |
| 81. Prefabr.buildings;sanitary,lighting etc.fixtrs | 239 | 0.4 | 113 | 112.6 |
| 82. Furniture and parts thereof | 1,023 | 1.9 | 635 | 61.1 |
| 83. Travel goods,handbags and sim.containers | 0 | 0.0 | 0 | -70.7 |
| 84. Articles of apparel and clothing accessories | 125 | 0.2 | 110 | 14.1 |
| 85. Footwear | 191 | 0.4 | 43 | 342.9 |
| 87. Instruments and apparates n.e.s. | 1,014 | 1.9 | 826 | 22.8 |
| 88. Photographic equipment,optical goods etc. | 3 | 0.0 | 0 | .. |
| 89. Miscellaneous manufactured articles,n.e.s. | 759 | 1.4 | 1,286 | -41.0 |
| 9. Goods not classified elsewhere | 64 | 0.1 | 532 | -88.0 |
| 93. Special transactions and commodities not classified | 64 | 0.1 | 532 | -88.0 |
| All groups combined | 54,495 | 100.0 | 43,503 | 25.3 |
| Classification | Description | Year level | Quarter level | Month level | Year 2026 sofar |
|---|---|---|---|---|---|
| SITC | Standard International Trade Classification (classification system is maintained by the United Nations) | ███ | ███ | ███ | ███ |
| BEC | The standard of statistical classification of BEC (Broad Economic Categories) is upheld by the UN and it is based on SITC-nomenclature. | ███ | ███ | ███ | ███ |
| NACE | National industrial classification based on Statistical Classification of Economic Activities in the European Community Nomenclature générale des Activités économiques dans les Communautés européennes | ███ | ███ | ███ | ███ |
| CPA | CPA = Classification of Products by Activities | ███ | ███ | ███ | ███ |
| CN | The Combined Nomenclature is the common nomenclature of the European Community. | ███ | ███ | ███ | ███ |