
| Export of goods from Finland and import to Finland | Trade Balance |

| Import 1,000 € | Export 1,000 € | Trade 1,000 € | Trade Balance 1,000 € | |
|---|---|---|---|---|
| 2019 Q1 | 28,262 | 19,115 | 47,377 | -9,147 |
| 2019 Q2 | 29,083 | 16,084 | 45,168 | -12,999 |
| 2019 Q3 | 28,952 | 14,677 | 43,629 | -14,276 |
| 2019 Q4 | 33,146 | 15,265 | 48,411 | -17,881 |
| 2020 Q1 | 29,465 | 17,339 | 46,804 | -12,126 |
| 2020 Q2 | 25,506 | 9,351 | 34,856 | -16,155 |
| 2020 Q3 | 27,466 | 13,769 | 41,236 | -13,697 |
| 2020 Q4 | 40,927 | 16,682 | 57,609 | -24,246 |
| 2021 Q1 | 33,517 | 17,089 | 50,606 | -16,429 |
| 2021 Q2 | 38,882 | 19,989 | 58,871 | -18,893 |
| 2021 Q3 | 36,796 | 19,797 | 56,594 | -16,999 |
| 2021 Q4 | 43,862 | 21,676 | 65,538 | -22,186 |
| 2022 Q1 | 40,880 | 21,870 | 62,751 | -19,010 |
| 2022 Q2 | 44,624 | 23,288 | 67,912 | -21,336 |
| 2022 Q3 | 47,168 | 21,121 | 68,289 | -26,048 |
| 2022 Q4 | 40,748 | 25,034 | 65,782 | -15,714 |
| 2023 Q1 | 38,067 | 27,563 | 65,629 | -10,504 |
| 2023 Q2 | 39,702 | 33,545 | 73,247 | -6,157 |
| 2023 Q3 | 30,802 | 38,735 | 69,537 | 7,933 |
| 2023 Q4 | 40,416 | 23,201 | 63,617 | -17,215 |
| 2024 Q1 | 36,488 | 21,953 | 58,440 | -14,535 |
| 2024 Q2 | 39,003 | 19,237 | 58,240 | -19,766 |
| 2024 Q3 | 37,600 | 19,203 | 56,803 | -18,397 |
| 2024 Q4 | 37,804 | 23,732 | 61,536 | -14,071 |
| 2025 Q1 | 37,364 | 20,049 | 57,414 | -17,315 |
| 2025 Q2 | 43,457 | 22,381 | 65,838 | -21,076 |
| 2025 Q3 | 42,881 | 24,216 | 67,096 | -18,665 |
| 2025 Q4 | 45,705 | 19,645 | 65,350 | -26,061 |
| 2026 Q1 | 56,118 | 21,278 | 77,396 | -34,839 |
| 2026 Q2 | 54,495 | 24,029 | 78,524 | -30,466 |

| Q2 / 2026 | Q2 / 2025 | Muutos edellisestä vastaavasta kaudesta % | ||
|---|---|---|---|---|
| 1,000 € | % | 1,000 € | ||
| 0. Food and live animals | 386 | 1.6 | 334 | 15.6 |
| 1. Beverages and tobacco | 12 | 0.1 | 4 | 238.4 |
| 2. Crude materials,inedible,except fuels | 346 | 1.4 | 129 | 167.6 |
| 3. Mineral fuels etc | 5 | 0.0 | 1 | 625.2 |
| 4. Animal and vegetable oils and fats | 0 | 0.0 | 0 | 42.9 |
| 5. Chemicals and related products,n.e.s. | 7,881 | 32.8 | 2,998 | 162.8 |
| 6. Basic manufactures | 5,599 | 23.3 | 6,489 | -13.7 |
| 7. Machinery,transport equipment | 7,648 | 31.8 | 10,567 | -27.6 |
| 8. Miscellaneous manufactured articles | 2,042 | 8.5 | 1,837 | 11.1 |
| 9. Goods not classified elsewhere | 110 | 0.5 | 78 | 40.8 |
| All groups combined | 24,029 | 100.0 | 22,437 | 7.1 |
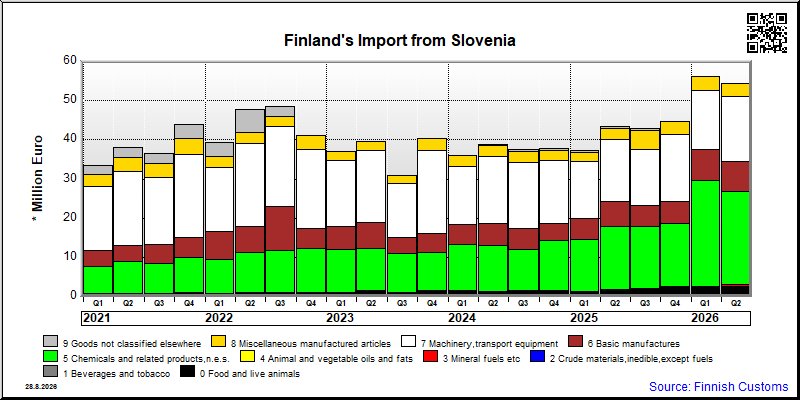
| Q2 / 2026 | Q2 / 2025 | Muutos edellisestä vastaavasta kaudesta % | ||
|---|---|---|---|---|
| 1,000 € | % | 1,000 € | ||
| 0. Food and live animals | 2,413 | 4.4 | 1,640 | 47.1 |
| 1. Beverages and tobacco | 8 | 0.0 | 5 | 62.2 |
| 2. Crude materials,inedible,except fuels | 205 | 0.4 | 150 | 36.6 |
| 3. Mineral fuels etc | 420 | 0.8 | 0 | .. |
| 4. Animal and vegetable oils and fats | 0 | 0.0 | 0 | .. |
| 5. Chemicals and related products,n.e.s. | 23,813 | 43.7 | 16,018 | 48.7 |
| 6. Basic manufactures | 7,589 | 13.9 | 6,556 | 15.8 |
| 7. Machinery,transport equipment | 16,626 | 30.5 | 15,588 | 6.7 |
| 8. Miscellaneous manufactured articles | 3,356 | 6.2 | 3,013 | 11.4 |
| 9. Goods not classified elsewhere | 64 | 0.1 | 532 | -88.0 |
| All groups combined | 54,495 | 100.0 | 43,503 | 25.3 |
| Classification | Description | Year level | Quarter level | Month level | Year 2026 sofar |
|---|---|---|---|---|---|
| SITC | Standard International Trade Classification (classification system is maintained by the United Nations) | ███ | ███ | ███ | ███ |
| BEC | The standard of statistical classification of BEC (Broad Economic Categories) is upheld by the UN and it is based on SITC-nomenclature. | ███ | ███ | ███ | ███ |
| NACE | National industrial classification based on Statistical Classification of Economic Activities in the European Community Nomenclature générale des Activités économiques dans les Communautés européennes | ███ | ███ | ███ | ███ |
| CPA | CPA = Classification of Products by Activities | ███ | ███ | ███ | ███ |
| CN | The Combined Nomenclature is the common nomenclature of the European Community. | ███ | ███ | ███ | ███ |