
| Export of goods from Finland and import to Finland | Trade Balance |

| Year | Import 1,000 € | Export 1,000 € | Trade 1,000 € | Trade balance 1,000 € |
|---|---|---|---|---|
| 2002 | 3,001 | 262 | 3,263 | -2,739 |
| 2003 | 3,819 | 190 | 4,009 | -3,629 |
| 2004 | 3,374 | 9,062 | 12,436 | 5,689 |
| 2005 | 3,689 | 15,157 | 18,845 | 11,468 |
| 2006 | 5,731 | 8,044 | 13,775 | 2,313 |
| 2007 | 7,314 | 237 | 7,551 | -7,077 |
| 2008 | 11,104 | 1,266 | 12,370 | -9,838 |
| 2009 | 12,201 | 555 | 12,756 | -11,646 |
| 2010 | 13,912 | 228 | 14,140 | -13,684 |
| 2011 | 13,729 | 216 | 13,945 | -13,513 |
| 2012 | 18,001 | 281 | 18,282 | -17,720 |
| 2013 | 24,598 | 223 | 24,821 | -24,375 |
| 2014 | 27,097 | 308 | 27,405 | -26,789 |
| 2015 | 34,879 | 3,903 | 38,783 | -30,976 |
| 2016 | 41,284 | 18,834 | 60,118 | -22,450 |
| 2017 | 45,301 | 42,534 | 87,835 | -2,767 |
| 2018 | 47,934 | 22,591 | 70,525 | -25,343 |
| 2019 | 47,520 | 38,564 | 86,084 | -8,956 |
| 2020 | 42,000 | 26,632 | 68,632 | -15,368 |
| 2021 | 46,828 | 100,193 | 147,021 | 53,365 |
| 2022 | 56,148 | 61,745 | 117,893 | 5,596 |
| 2023 | 47,977 | 110,764 | 158,741 | 62,788 |
| 2024 | 47,989 | 132,687 | 180,676 | 84,697 |
| 2025 | 48,691 | 112,505 | 161,195 | 63,814 |
*) SITC = Standard International Trade Classification (classification system is maintained by the United Nations)
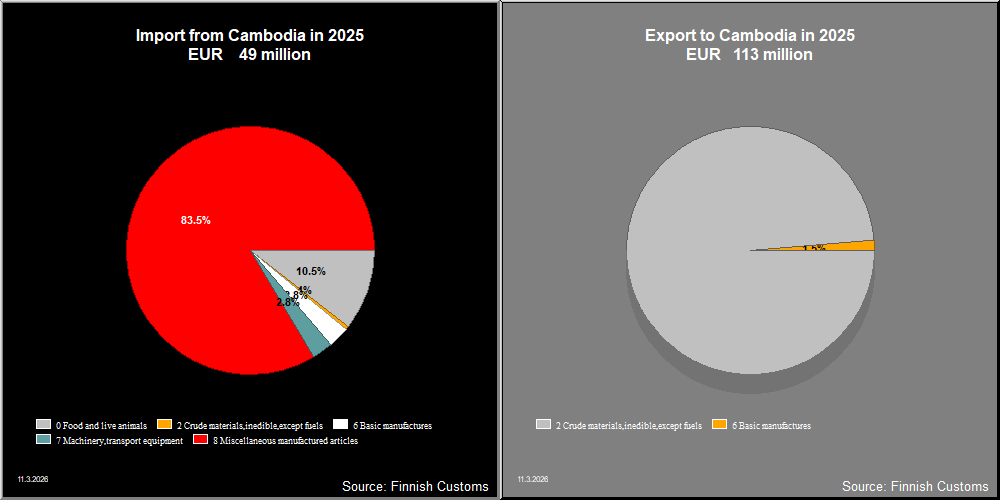
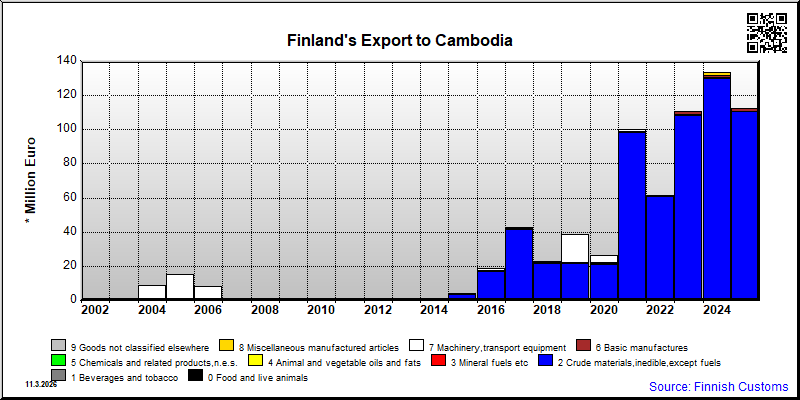
| 2021 | 2022 | 2023 | 2024 | 2025 | ||||||
|---|---|---|---|---|---|---|---|---|---|---|
| 1,000 € | % | 1,000 € | % | 1,000 € | % | 1,000 € | % | 1,000 € | % | |
| 0. Food and live animals | 1 | 0.0 | 1 | 0.0 | 90 | 0.1 | ||||
| 00. Live animals | 90 | 0.1 | ||||||||
| 2. Crude materials,inedible,except fuels | 98,157 | 98.0 | 60,753 | 98.4 | 108,400 | 97.9 | 129,932 | 97.2 | 110,552 | 98.3 |
| 21. Hides,skins,furskins,raw | 97,880 | 97.7 | 60,651 | 98.2 | 108,400 | 97.9 | 129,932 | 97.2 | 109,292 | 97.1 |
| 24. Cork and wood | 277 | 0.3 | 98 | 0.2 | 1,259 | 1.1 | ||||
| 29. Crude animal,vegetable materials n.e.s. | 4 | 0.0 | ||||||||
| 5. Chemicals and related products,n.e.s. | 503 | 0.5 | 410 | 0.7 | 592 | 0.5 | 602 | 0.5 | 123 | 0.1 |
| 54. Medicinal and pharmaceutical products | 342 | 0.3 | 304 | 0.5 | 476 | 0.4 | 458 | 0.3 | ||
| 57. Plastics in primary forms | 4 | 0.0 | ||||||||
| 58. Plastics in non-primary forms | 74 | 0.1 | 27 | 0.0 | 3 | 0.0 | 5 | 0.0 | ||
| 59. Chemical materials and products,n.e.s. | 87 | 0.1 | 79 | 0.1 | 116 | 0.1 | 141 | 0.1 | 114 | 0.1 |
| 6. Basic manufactures | 281 | 0.3 | 321 | 0.5 | 1,412 | 1.3 | 1,023 | 0.8 | 1,642 | 1.5 |
| 61. Leather,dressed fur,etc. | 5 | 0.0 | ||||||||
| 62. Rubber manufactures,n.e.s. | 7 | 0.0 | 1 | 0.0 | ||||||
| 63. Wood and cork manufactures | 6 | 0.0 | 18 | 0.0 | 70 | 0.1 | ||||
| 64. Paper,paperboard and articles thereof | 268 | 0.3 | 311 | 0.5 | 1,390 | 1.3 | 974 | 0.7 | 1,168 | 1.0 |
| 65. Textile yarn,fabrics,made up articles,etc. | 7 | 0.0 | 5 | 0.0 | 13 | 0.0 | 96 | 0.1 | ||
| 66. Non-metallic mineral manufactures,n.e.s. | 1 | 0.0 | ||||||||
| 67. Iron and steel | 1 | 0.0 | ||||||||
| 69. Manufactures of metals,n.e.s. | 5 | 0.0 | 4 | 0.0 | 10 | 0.0 | 12 | 0.0 | 307 | 0.3 |
| 7. Machinery,transport equipment | 1,020 | 1.0 | 182 | 0.3 | 257 | 0.2 | 463 | 0.3 | 124 | 0.1 |
| 71. Power generating machinery and equipment | 14 | 0.0 | ||||||||
| 72. Machinery for specialized industries | 880 | 0.9 | 4 | 0.0 | 85 | 0.1 | 22 | 0.0 | 19 | 0.0 |
| 74. General industrial machinery n.e.s. | 32 | 0.0 | 15 | 0.0 | 91 | 0.1 | 18 | 0.0 | 2 | 0.0 |
| 75. Office machines and adp machines | 2 | 0.0 | ||||||||
| 76. Telecommunications and sound recording equipment | 1 | 0.0 | 1 | 0.0 | 4 | 0.0 | ||||
| 77. Electric machinery,n.e.s.and parts | 93 | 0.1 | 163 | 0.3 | 80 | 0.1 | 423 | 0.3 | 98 | 0.1 |
| 78. Road vehicles | 1 | 0.0 | ||||||||
| 8. Miscellaneous manufactured articles | 231 | 0.2 | 77 | 0.1 | 13 | 0.0 | 1,717 | 1.3 | 63 | 0.1 |
| 81. Prefabr.buildings;sanitary,lighting etc.fixtrs | 4 | 0.0 | ||||||||
| 82. Furniture and parts thereof | 2 | 0.0 | 4 | 0.0 | ||||||
| 84. Articles of apparel and clothing accessories | 2 | 0.0 | 6 | 0.0 | 2 | 0.0 | 5 | 0.0 | 1 | 0.0 |
| 85. Footwear | 1 | 0.0 | 1 | 0.0 | ||||||
| 87. Instruments and apparates n.e.s. | 220 | 0.2 | 70 | 0.1 | 11 | 0.0 | 1,556 | 1.2 | 61 | 0.1 |
| 88. Photographic equipment,optical goods etc. | 6 | 0.0 | 1 | 0.0 | ||||||
| 89. Miscellaneous manufactured articles,n.e.s. | 1 | 0.0 | 146 | 0.1 | ||||||
| All groups combined | 100,193 | 100.0 | 61,745 | 100.0 | 110,764 | 100.0 | 133,738 | 100.0 | 112,505 | 100.0 |

| 2021 | 2022 | 2023 | 2024 | 2025 | ||||||
|---|---|---|---|---|---|---|---|---|---|---|
| 1,000 € | % | 1,000 € | % | 1,000 € | % | 1,000 € | % | 1,000 € | % | |
| 0. Food and live animals | 1,104 | 2.4 | 1,657 | 2.9 | 2,535 | 5.2 | 3,361 | 7.0 | 5,130 | 10.5 |
| 04. Cereals and cereal preparations | 1,020 | 2.2 | 1,428 | 2.5 | 2,373 | 4.8 | 2,826 | 5.9 | 3,389 | 6.9 |
| 05. Vegetables and fruit | 41 | 0.1 | 397 | 0.8 | 1,564 | 3.2 | ||||
| 07. Coffee,tea,cocoa,spices | 5 | 0.0 | 8 | 0.0 | 9 | 0.0 | ||||
| 09. Miscellaneous edible products and preparations | 84 | 0.2 | 229 | 0.4 | 116 | 0.2 | 130 | 0.3 | 168 | 0.3 |
| 2. Crude materials,inedible,except fuels | 36 | 0.1 | 217 | 0.4 | ||||||
| 23. Crude rubber (incl.synthetic) | 36 | 0.1 | 217 | 0.4 | ||||||
| 5. Chemicals and related products,n.e.s. | 1 | 0.0 | 13 | 0.0 | 4 | 0.0 | 17 | 0.0 | ||
| 54. Medicinal and pharmaceutical products | 4 | 0.0 | 15 | 0.0 | ||||||
| 55. Perfume,cleaning etc.preparations | 1 | 0.0 | 8 | 0.0 | 2 | 0.0 | ||||
| 58. Plastics in non-primary forms | 1 | 0.0 | ||||||||
| 59. Chemical materials and products,n.e.s. | 5 | 0.0 | ||||||||
| 6. Basic manufactures | 67 | 0.1 | 191 | 0.3 | 205 | 0.4 | 243 | 0.5 | 1,341 | 2.7 |
| 61. Leather,dressed fur,etc. | 2 | 0.0 | 4 | 0.0 | 47 | 0.1 | 115 | 0.2 | 93 | 0.2 |
| 62. Rubber manufactures,n.e.s. | 7 | 0.0 | 1 | 0.0 | 2 | 0.0 | 5 | 0.0 | 859 | 1.8 |
| 63. Wood and cork manufactures | 1 | 0.0 | 9 | 0.0 | ||||||
| 64. Paper,paperboard and articles thereof | 1 | 0.0 | 10 | 0.0 | 1 | 0.0 | 3 | 0.0 | ||
| 65. Textile yarn,fabrics,made up articles,etc. | 52 | 0.1 | 181 | 0.3 | 136 | 0.3 | 105 | 0.2 | 309 | 0.6 |
| 66. Non-metallic mineral manufactures,n.e.s. | 2 | 0.0 | 3 | 0.0 | 4 | 0.0 | ||||
| 67. Iron and steel | 1 | 0.0 | 15 | 0.0 | 56 | 0.1 | ||||
| 69. Manufactures of metals,n.e.s. | 4 | 0.0 | 4 | 0.0 | 4 | 0.0 | 2 | 0.0 | 9 | 0.0 |
| 7. Machinery,transport equipment | 4,171 | 9.0 | 3,858 | 6.7 | 3,404 | 6.9 | 1,260 | 2.6 | 1,360 | 2.8 |
| 71. Power generating machinery and equipment | 67 | 0.1 | 140 | 0.2 | 57 | 0.1 | ||||
| 74. General industrial machinery n.e.s. | 15 | 0.0 | 36 | 0.1 | 130 | 0.3 | 120 | 0.3 | 95 | 0.2 |
| 75. Office machines and adp machines | 1 | 0.0 | 2 | 0.0 | 1 | 0.0 | ||||
| 76. Telecommunications and sound recording equipment | 23 | 0.1 | 387 | 0.7 | 564 | 1.1 | 274 | 0.6 | 428 | 0.9 |
| 77. Electric machinery,n.e.s.and parts | 42 | 0.1 | 72 | 0.1 | 87 | 0.2 | 85 | 0.2 | 111 | 0.2 |
| 78. Road vehicles | 4,024 | 8.7 | 3,223 | 5.6 | 2,566 | 5.2 | 779 | 1.6 | 726 | 1.5 |
| 8. Miscellaneous manufactured articles | 34,819 | 75.2 | 49,587 | 86.3 | 43,037 | 87.5 | 43,100 | 89.8 | 40,697 | 83.5 |
| 82. Furniture and parts thereof | 409 | 0.9 | 201 | 0.4 | 205 | 0.4 | 96 | 0.2 | 84 | 0.2 |
| 83. Travel goods,handbags and sim.containers | 931 | 2.0 | 1,610 | 2.8 | 1,819 | 3.7 | 1,792 | 3.7 | 1,433 | 2.9 |
| 84. Articles of apparel and clothing accessories | 27,291 | 59.0 | 35,658 | 62.1 | 30,452 | 61.9 | 32,415 | 67.5 | 30,543 | 62.6 |
| 85. Footwear | 5,947 | 12.8 | 11,766 | 20.5 | 10,224 | 20.8 | 8,532 | 17.8 | 8,430 | 17.3 |
| 87. Instruments and apparates n.e.s. | 9 | 0.0 | 2 | 0.0 | 1 | 0.0 | 30 | 0.1 | 2 | 0.0 |
| 88. Photographic equipment,optical goods etc. | 1 | 0.0 | 1 | 0.0 | 18 | 0.0 | 12 | 0.0 | 16 | 0.0 |
| 89. Miscellaneous manufactured articles,n.e.s. | 232 | 0.5 | 348 | 0.6 | 318 | 0.6 | 224 | 0.5 | 187 | 0.4 |
| 9. Goods not classified elsewhere | 6,128 | 13.2 | 2,137 | 3.7 | 3 | 0.0 | 2 | 0.0 | 4 | 0.0 |
| 93. Special transactions and commodities not classified | 6,128 | 13.2 | 2,137 | 3.7 | 3 | 0.0 | 2 | 0.0 | 4 | 0.0 |
| All groups combined | 46,289 | 100.0 | 57,432 | 100.0 | 49,198 | 100.0 | 48,006 | 100.0 | 48,766 | 100.0 |
| Classification | Description | Year level | Quarter level | Month level | |
|---|---|---|---|---|---|
| SITC | Standard International Trade Classification (classification system is maintained by the United Nations) | ███ | ███ | ███ | |
| BEC | The standard of statistical classification of BEC (Broad Economic Categories) is upheld by the UN and it is based on SITC-nomenclature. | ███ | ███ | ███ | |
| NACE | National industrial classification based on Statistical Classification of Economic Activities in the European Community Nomenclature générale des Activités économiques dans les Communautés européennes | ███ | ███ | ███ | |
| CPA | CPA = Classification of Products by Activities | ███ | ███ | ███ | |
| CN | The Combined Nomenclature is the common nomenclature of the European Community. | ███ | ███ | ███ |