
| Export of goods from Finland and import to Finland | Trade Balance |

| Import 1,000 € | Export 1,000 € | Trade 1,000 € | Trade Balance 1,000 € | |
|---|---|---|---|---|
| 2019 Q1 | 1,797,706 | 1,532,061 | 3,329,766 | -265,645 |
| 2019 Q2 | 1,840,600 | 1,649,217 | 3,489,817 | -191,383 |
| 2019 Q3 | 2,057,720 | 1,638,671 | 3,696,391 | -419,049 |
| 2019 Q4 | 1,947,429 | 1,662,179 | 3,609,608 | -285,250 |
| 2020 Q1 | 1,878,264 | 1,438,701 | 3,316,965 | -439,563 |
| 2020 Q2 | 1,971,070 | 1,461,145 | 3,432,216 | -509,925 |
| 2020 Q3 | 2,125,605 | 1,491,058 | 3,616,663 | -634,546 |
| 2020 Q4 | 1,986,276 | 1,630,198 | 3,616,474 | -356,079 |
| 2021 Q1 | 2,118,600 | 1,590,729 | 3,709,328 | -527,871 |
| 2021 Q2 | 2,333,842 | 1,844,639 | 4,178,481 | -489,204 |
| 2021 Q3 | 2,461,767 | 1,764,129 | 4,225,895 | -697,638 |
| 2021 Q4 | 2,978,699 | 1,904,841 | 4,883,540 | -1,073,858 |
| 2022 Q1 | 2,812,743 | 1,807,433 | 4,620,176 | -1,005,311 |
| 2022 Q2 | 3,314,699 | 2,053,039 | 5,367,738 | -1,261,659 |
| 2022 Q3 | 3,553,562 | 2,344,966 | 5,898,528 | -1,208,596 |
| 2022 Q4 | 3,228,377 | 2,524,176 | 5,752,553 | -704,201 |
| 2023 Q1 | 2,783,057 | 2,237,552 | 5,020,609 | -545,505 |
| 2023 Q2 | 2,693,763 | 2,277,325 | 4,971,087 | -416,438 |
| 2023 Q3 | 2,689,292 | 1,993,171 | 4,682,462 | -696,121 |
| 2023 Q4 | 2,904,301 | 1,915,130 | 4,819,431 | -989,170 |
| 2024 Q1 | 2,385,848 | 1,605,291 | 3,991,139 | -780,556 |
| 2024 Q2 | 3,127,268 | 2,235,567 | 5,362,835 | -891,700 |
| 2024 Q3 | 2,876,378 | 1,837,497 | 4,713,875 | -1,038,881 |
| 2024 Q4 | 2,728,112 | 1,953,713 | 4,681,825 | -774,399 |
| 2025 Q1 | 2,710,259 | 1,906,505 | 4,616,764 | -803,755 |
| 2025 Q2 | 2,616,369 | 1,699,035 | 4,315,404 | -917,333 |
| 2025 Q3 | 3,048,260 | 1,745,289 | 4,793,548 | -1,302,971 |
| 2025 Q4 | 2,885,555 | 1,995,673 | 4,881,228 | -889,882 |
| 2026 Q1 | 3,301,968 | 2,018,116 | 5,320,084 | -1,283,852 |
| 2026 Q2 | 3,380,680 | 2,103,269 | 5,483,949 | -1,277,411 |
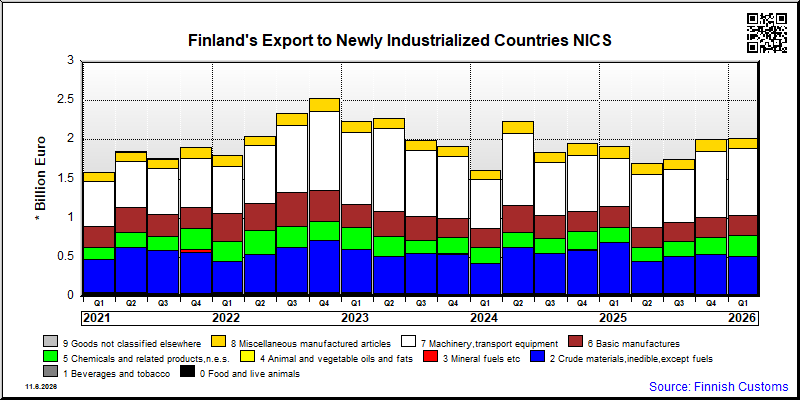
| Q2 / 2026 | Q2 / 2025 | Muutos edellisestä vastaavasta kaudesta % | ||
|---|---|---|---|---|
| 1,000 € | % | 1,000 € | ||
| 0. Food and live animals | 38,586 | 1.8 | 36,907 | 4.6 |
| 1. Beverages and tobacco | 348 | 0.0 | 630 | -44.7 |
| 2. Crude materials,inedible,except fuels | 571,236 | 27.2 | 406,797 | 40.4 |
| 3. Mineral fuels etc | 3,233 | 0.2 | 1,983 | 63.1 |
| 4. Animal and vegetable oils and fats | 58 | 0.0 | 57 | 1.2 |
| 5. Chemicals and related products,n.e.s. | 253,528 | 12.1 | 178,945 | 41.7 |
| 6. Basic manufactures | 272,844 | 13.0 | 255,373 | 6.8 |
| 7. Machinery,transport equipment | 829,139 | 39.4 | 680,814 | 21.8 |
| 8. Miscellaneous manufactured articles | 134,297 | 6.4 | 135,846 | -1.1 |
| 9. Goods not classified elsewhere | 0 | 0 | 0 | .. |
| All groups combined | 2,103,269 | 100.0 | 1,697,351 | 23.9 |
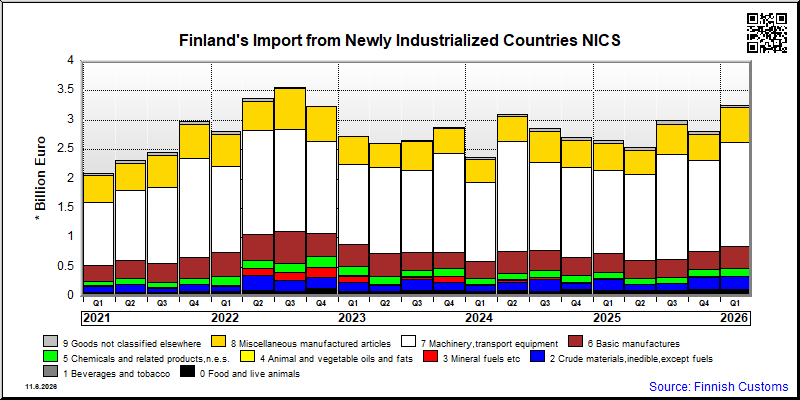
| Q2 / 2026 | Q2 / 2025 | Muutos edellisestä vastaavasta kaudesta % | ||
|---|---|---|---|---|
| 1,000 € | % | 1,000 € | ||
| 0. Food and live animals | 106,910 | 3.2 | 92,511 | 15.6 |
| 1. Beverages and tobacco | 3,169 | 0.1 | 3,100 | 2.2 |
| 2. Crude materials,inedible,except fuels | 114,387 | 3.4 | 108,191 | 5.7 |
| 3. Mineral fuels etc | 429 | 0.0 | 559 | -23.1 |
| 4. Animal and vegetable oils and fats | 7,980 | 0.2 | 2,754 | 189.7 |
| 5. Chemicals and related products,n.e.s. | 166,181 | 4.9 | 102,088 | 62.8 |
| 6. Basic manufactures | 431,684 | 12.8 | 311,144 | 38.7 |
| 7. Machinery,transport equipment | 1,976,873 | 58.5 | 1,463,401 | 35.1 |
| 8. Miscellaneous manufactured articles | 525,844 | 15.6 | 401,026 | 31.1 |
| 9. Goods not classified elsewhere | 47,221 | 1.4 | 58,952 | -19.9 |
| All groups combined | 3,380,680 | 100.0 | 2,543,726 | 32.9 |
| Classification | Description | Year level | Quarter level | Month level | Year 2026 sofar |
|---|---|---|---|---|---|
| SITC | Standard International Trade Classification (classification system is maintained by the United Nations) | ███ | ███ | ███ | ███ |
| BEC | The standard of statistical classification of BEC (Broad Economic Categories) is upheld by the UN and it is based on SITC-nomenclature. | ███ | ███ | ███ | ███ |
| NACE | National industrial classification based on Statistical Classification of Economic Activities in the European Community Nomenclature générale des Activités économiques dans les Communautés européennes | ███ | ███ | ███ | ███ |
| CPA | CPA = Classification of Products by Activities | ███ | ███ | ███ | ███ |
| CN | The Combined Nomenclature is the common nomenclature of the European Community. | ███ | ███ | ███ | ███ |