
| Export of goods from Finland and import to Finland | BEC (Broad Economic Categories) |
*) The standard of statistical classification of BEC (Broad Economic Categories) is upheld by the UN and it is based on SITC-nomenclature.
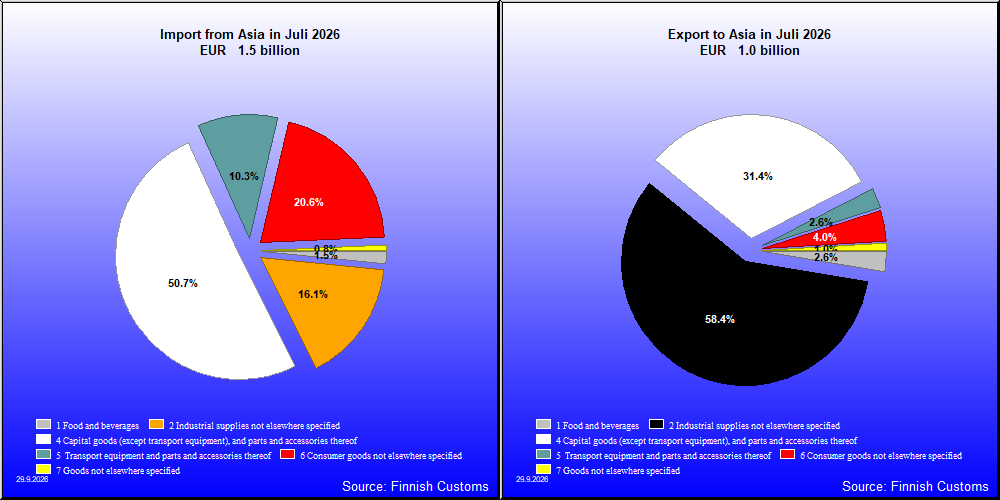

| 8 / 2026 | 8 / 2025 | Change from previous year's equal month % | ||
|---|---|---|---|---|
| 1,000 € | % | 1000 € | ||
| 1. Food and beverages | 20,268 | 2.9 | 21,497 | -5.7 |
| 11. Food and beverages, primary | 398 | 0.1 | 1,185 | -66.4 |
| 111. Food and beverages, primary, mainly for industry | 3 | 0.0 | 0 | .. |
| 112. Food and beverages, primary, mainly for household consumption | 395 | 0.1 | 1,185 | -66.6 |
| 12. Food and beverages, processed | 19,870 | 2.8 | 20,313 | -2.2 |
| 121. Food and beverages, processed, mainly for industry | 11,700 | 1.7 | 8,548 | 36.9 |
| 122. Food and beverages, processed, mainly for household consumption | 8,171 | 1.2 | 11,765 | -30.6 |
| 2. Industrial supplies not elsewhere specified | 355,350 | 50.6 | 319,934 | 11.1 |
| 21. Industrial supplies not elsewhere specified, primary | 55,837 | 7.9 | 17,301 | 222.7 |
| 22. Industrial supplies not elsewhere specified, processed | 299,513 | 42.6 | 302,633 | -1.0 |
| 3. Fuels and lubricants | 134 | 0.0 | 272 | -50.6 |
| 31. Fuels and lubricants, primary | 79 | 0.0 | 246 | -68.1 |
| 32. Fuels and lubricants, processed | 56 | 0.0 | 26 | 118.7 |
| 322. Fuels and lubricants, other | 56 | 0.0 | 26 | 118.7 |
| 4. Capital goods (except transport equipment), and parts and accessories thereof | 270,073 | 38.4 | 245,260 | 10.1 |
| 41. Capital goods (except transport equipment) | 155,068 | 22.1 | 145,254 | 6.8 |
| 42. Capital goods (except transport equipment), parts and accessories | 115,005 | 16.4 | 100,006 | 15.0 |
| 5. Transport equipment and parts and accessories thereof | 27,836 | 4.0 | 24,668 | 12.8 |
| 52. Transport equipment, other than passenger motor vehicles | 8,420 | 1.2 | 5,267 | 59.9 |
| 521. Transport equipment, other than passenger motor vehicles, industrial | 5,065 | 0.7 | 2,394 | 111.6 |
| 522. Transport equipment, other than passenger motor vehicles, non-industrial | 3,355 | 0.5 | 2,873 | 16.8 |
| 53. Transport equipment, parts and accessories | 19,416 | 2.8 | 19,401 | 0.1 |
| 6. Consumer goods not elsewhere specified | 23,987 | 3.4 | 14,619 | 64.1 |
| 61. Consumer goods not elsewhere specified, durable | 2,430 | 0.3 | 2,560 | -5.1 |
| 62. Consumer goods not elsewhere specified, semi-durable | 10,161 | 1.4 | 7,644 | 32.9 |
| 63. Consumer goods not elsewhere specified, non-durable | 11,396 | 1.6 | 4,415 | 158.1 |
| 7. Goods not elsewhere specified | 4,900 | 0.7 | 5,300 | -7.5 |
| All groups | 702,549 | 100.0 | 631,540 | 11.2 |

| 8 / 2026 | 8 / 2025 | Change from previous year's equal month % | ||
|---|---|---|---|---|
| 1,000 € | % | 1,000 € | ||
| 1. Food and beverages | 19,031 | 1.2 | 15,244 | 24.8 |
| 11. Food and beverages, primary | 3,811 | 0.2 | 2,765 | 37.8 |
| 111. Food and beverages, primary, mainly for industry | 482 | 0.0 | 174 | 176.3 |
| 112. Food and beverages, primary, mainly for household consumption | 3,329 | 0.2 | 2,591 | 28.5 |
| 12. Food and beverages, processed | 15,220 | 1.0 | 12,478 | 22.0 |
| 121. Food and beverages, processed, mainly for industry | 618 | 0.0 | 192 | 221.9 |
| 122. Food and beverages, processed, mainly for household consumption | 14,602 | 0.9 | 12,287 | 18.8 |
| 2. Industrial supplies not elsewhere specified | 237,371 | 14.8 | 152,672 | 55.5 |
| 21. Industrial supplies not elsewhere specified, primary | 9,072 | 0.6 | 7,492 | 21.1 |
| 22. Industrial supplies not elsewhere specified, processed | 228,299 | 14.3 | 145,180 | 57.3 |
| 3. Fuels and lubricants | 1,306 | 0.1 | 37,415 | -96.5 |
| 31. Fuels and lubricants, primary | 0 | 0 | 0 | .. |
| 32. Fuels and lubricants, processed | 1,306 | 0.1 | 37,415 | -96.5 |
| 322. Fuels and lubricants, other | 1,306 | 0.1 | 37,415 | -96.5 |
| 4. Capital goods (except transport equipment), and parts and accessories thereof | 872,229 | 54.5 | 406,291 | 114.7 |
| 41. Capital goods (except transport equipment) | 578,156 | 36.2 | 282,430 | 104.7 |
| 42. Capital goods (except transport equipment), parts and accessories | 294,074 | 18.4 | 123,860 | 137.4 |
| 5. Transport equipment and parts and accessories thereof | 140,759 | 8.8 | 136,764 | 2.9 |
| 51. Passenger motor vehicles | 42,364 | 2.6 | 36,800 | 15.1 |
| 52. Transport equipment, other than passenger motor vehicles | 7,436 | 0.5 | 6,432 | 15.6 |
| 521. Transport equipment, other than passenger motor vehicles, industrial | 2,510 | 0.2 | 4,216 | -40.5 |
| 522. Transport equipment, other than passenger motor vehicles, non-industrial | 4,926 | 0.3 | 2,216 | 122.3 |
| 53. Transport equipment, parts and accessories | 90,959 | 5.7 | 93,532 | -2.8 |
| 6. Consumer goods not elsewhere specified | 317,358 | 19.8 | 222,603 | 42.6 |
| 61. Consumer goods not elsewhere specified, durable | 57,347 | 3.6 | 37,356 | 53.5 |
| 62. Consumer goods not elsewhere specified, semi-durable | 200,477 | 12.5 | 140,257 | 42.9 |
| 63. Consumer goods not elsewhere specified, non-durable | 59,534 | 3.7 | 44,989 | 32.3 |
| 7. Goods not elsewhere specified | 11,018 | 0.7 | 23,038 | -52.2 |
| All groups | 1,599,072 | 100.0 | 994,025 | 60.9 |
| Classification | Description | Year level | Quarter level | Month level | Year 2026 sofar |
|---|---|---|---|---|---|
| SITC | Standard International Trade Classification (classification system is maintained by the United Nations) | ███ | ███ | ███ | ███ |
| BEC | The standard of statistical classification of BEC (Broad Economic Categories) is upheld by the UN and it is based on SITC-nomenclature. | ███ | ███ | ███ | ███ |
| NACE | National industrial classification based on Statistical Classification of Economic Activities in the European Community Nomenclature générale des Activités économiques dans les Communautés européennes | ███ | ███ | ███ | ███ |
| CPA | CPA = Classification of Products by Activities | ███ | ███ | ███ | ███ |
| CN | The Combined Nomenclature is the common nomenclature of the European Community. | ███ | ███ | ███ | ███ |