
| Export of goods from Finland and import to Finland | BEC (Broad Economic Categories) |
*) The standard of statistical classification of BEC (Broad Economic Categories) is upheld by the UN and it is based on SITC-nomenclature.


| 8 / 2026 | 8 / 2025 | Change from previous year's equal month % | ||
|---|---|---|---|---|
| 1,000 € | % | 1000 € | ||
| 1. Food and beverages | 1,044 | 0.9 | 747 | 39.9 |
| 11. Food and beverages, primary | 0 | 0.0 | 0 | 145.0 |
| 111. Food and beverages, primary, mainly for industry | 0 | 0 | 0 | .. |
| 112. Food and beverages, primary, mainly for household consumption | 0 | 0.0 | 0 | .. |
| 12. Food and beverages, processed | 1,044 | 0.9 | 746 | 39.9 |
| 121. Food and beverages, processed, mainly for industry | 461 | 0.4 | 387 | 19.0 |
| 122. Food and beverages, processed, mainly for household consumption | 583 | 0.5 | 359 | 62.4 |
| 2. Industrial supplies not elsewhere specified | 76,367 | 63.1 | 56,829 | 34.4 |
| 21. Industrial supplies not elsewhere specified, primary | 234 | 0.2 | 2,625 | -91.1 |
| 22. Industrial supplies not elsewhere specified, processed | 76,133 | 62.9 | 54,205 | 40.5 |
| 3. Fuels and lubricants | 7 | 0.0 | 28 | -74.5 |
| 31. Fuels and lubricants, primary | 7 | 0.0 | 19 | -64.5 |
| 32. Fuels and lubricants, processed | 1 | 0.0 | 9 | -94.7 |
| 322. Fuels and lubricants, other | 1 | 0.0 | 9 | -94.7 |
| 4. Capital goods (except transport equipment), and parts and accessories thereof | 31,659 | 26.2 | 34,811 | -9.1 |
| 41. Capital goods (except transport equipment) | 23,944 | 19.8 | 26,431 | -9.4 |
| 42. Capital goods (except transport equipment), parts and accessories | 7,715 | 6.4 | 8,380 | -7.9 |
| 5. Transport equipment and parts and accessories thereof | 11,049 | 9.1 | 6,920 | 59.7 |
| 51. Passenger motor vehicles | 312 | 0.3 | 206 | 51.5 |
| 52. Transport equipment, other than passenger motor vehicles | 10,530 | 8.7 | 6,209 | 69.6 |
| 521. Transport equipment, other than passenger motor vehicles, industrial | 10,523 | 8.7 | 5,785 | 81.9 |
| 522. Transport equipment, other than passenger motor vehicles, non-industrial | 7 | 0.0 | 425 | -98.3 |
| 53. Transport equipment, parts and accessories | 206 | 0.2 | 505 | -59.1 |
| 6. Consumer goods not elsewhere specified | 931 | 0.8 | 1,356 | -31.3 |
| 61. Consumer goods not elsewhere specified, durable | 589 | 0.5 | 826 | -28.7 |
| 62. Consumer goods not elsewhere specified, semi-durable | 199 | 0.2 | 122 | 62.6 |
| 63. Consumer goods not elsewhere specified, non-durable | 144 | 0.1 | 408 | -64.8 |
| 7. Goods not elsewhere specified | 0 | 0 | 4,261 | .. |
| All groups | 121,058 | 100.0 | 104,952 | 15.3 |
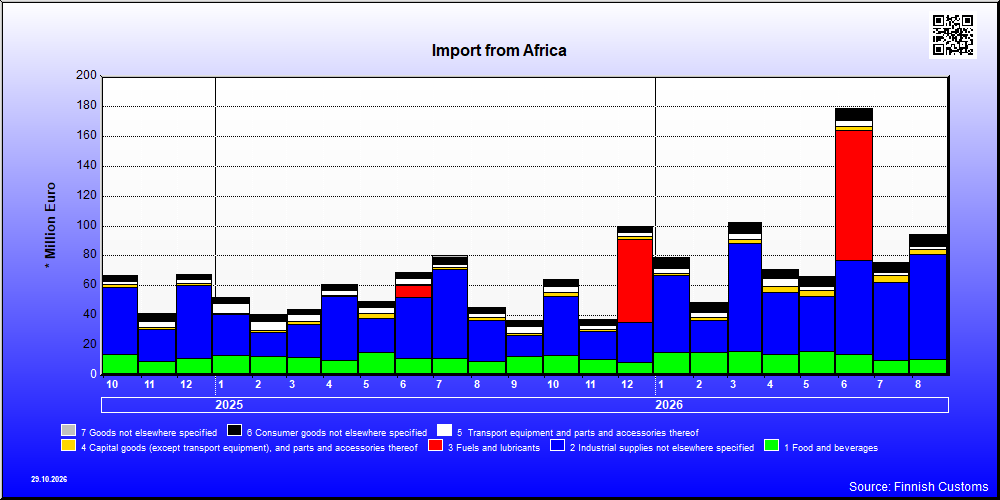
| 8 / 2026 | 8 / 2025 | Change from previous year's equal month % | ||
|---|---|---|---|---|
| 1,000 € | % | 1,000 € | ||
| 1. Food and beverages | 10,764 | 11.4 | 9,692 | 11.1 |
| 11. Food and beverages, primary | 8,854 | 9.4 | 7,823 | 13.2 |
| 111. Food and beverages, primary, mainly for industry | 2,115 | 2.2 | 770 | 174.5 |
| 112. Food and beverages, primary, mainly for household consumption | 6,739 | 7.1 | 7,053 | -4.4 |
| 12. Food and beverages, processed | 1,909 | 2.0 | 1,869 | 2.2 |
| 121. Food and beverages, processed, mainly for industry | 82 | 0.1 | 41 | 99.3 |
| 122. Food and beverages, processed, mainly for household consumption | 1,827 | 1.9 | 1,827 | -0.0 |
| 2. Industrial supplies not elsewhere specified | 70,230 | 74.4 | 27,406 | 156.3 |
| 21. Industrial supplies not elsewhere specified, primary | 53,378 | 56.5 | 4,611 | .. |
| 22. Industrial supplies not elsewhere specified, processed | 16,851 | 17.8 | 22,796 | -26.1 |
| 3. Fuels and lubricants | 78 | 0.1 | 1 | .. |
| 31. Fuels and lubricants, primary | 0 | 0.0 | 0 | .. |
| 32. Fuels and lubricants, processed | 78 | 0.1 | 1 | .. |
| 322. Fuels and lubricants, other | 78 | 0.1 | 1 | .. |
| 4. Capital goods (except transport equipment), and parts and accessories thereof | 3,212 | 3.4 | 1,553 | 106.8 |
| 41. Capital goods (except transport equipment) | 1,293 | 1.4 | 847 | 52.7 |
| 42. Capital goods (except transport equipment), parts and accessories | 1,919 | 2.0 | 706 | 171.6 |
| 5. Transport equipment and parts and accessories thereof | 1,960 | 2.1 | 2,504 | -21.7 |
| 51. Passenger motor vehicles | 626 | 0.7 | 312 | 100.6 |
| 52. Transport equipment, other than passenger motor vehicles | 274 | 0.3 | 1,819 | -84.9 |
| 521. Transport equipment, other than passenger motor vehicles, industrial | 274 | 0.3 | 1,714 | -84.0 |
| 522. Transport equipment, other than passenger motor vehicles, non-industrial | 0 | 0 | 104 | .. |
| 53. Transport equipment, parts and accessories | 1,061 | 1.1 | 373 | 184.1 |
| 6. Consumer goods not elsewhere specified | 8,157 | 8.6 | 4,136 | 97.2 |
| 61. Consumer goods not elsewhere specified, durable | 1,963 | 2.1 | 610 | 221.6 |
| 62. Consumer goods not elsewhere specified, semi-durable | 3,990 | 4.2 | 1,843 | 116.5 |
| 63. Consumer goods not elsewhere specified, non-durable | 2,205 | 2.3 | 1,683 | 31.0 |
| 7. Goods not elsewhere specified | 9 | 0.0 | 12 | -22.4 |
| All groups | 94,410 | 100.0 | 45,304 | 108.4 |
| Classification | Description | Year level | Quarter level | Month level | Year 2026 sofar |
|---|---|---|---|---|---|
| SITC | Standard International Trade Classification (classification system is maintained by the United Nations) | ███ | ███ | ███ | ███ |
| BEC | The standard of statistical classification of BEC (Broad Economic Categories) is upheld by the UN and it is based on SITC-nomenclature. | ███ | ███ | ███ | ███ |
| NACE | National industrial classification based on Statistical Classification of Economic Activities in the European Community Nomenclature générale des Activités économiques dans les Communautés européennes | ███ | ███ | ███ | ███ |
| CPA | CPA = Classification of Products by Activities | ███ | ███ | ███ | ███ |
| CN | The Combined Nomenclature is the common nomenclature of the European Community. | ███ | ███ | ███ | ███ |