
| Export of goods from Finland and import to Finland | Trade Balance |
The value of imports from Switzerland was 12.1 per cent higher than in Juli of the previous year, thus amounting now to €67 million. Major product categories of imports from Switzerland were Sitc 542 (medicaments (including veterinary medicaments)), representing 11.4 per cent of imports, Sitc 682 (copper) 9.1 % and Sitc 728 (other machinery and equipment specialized for particular industries; parts thereof, n.e.s.) 7.2 % of the imports.
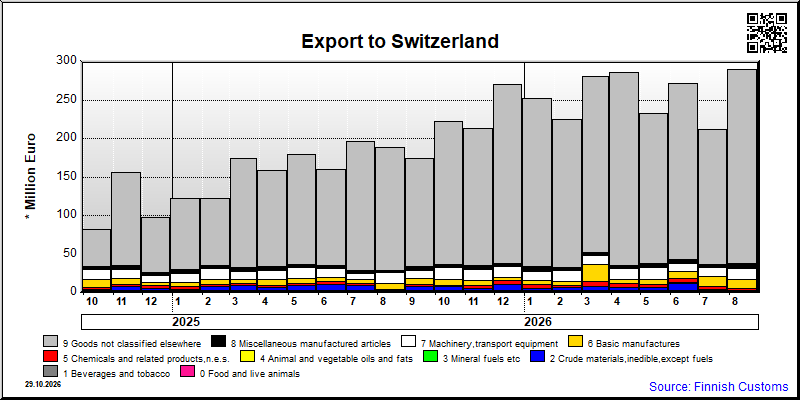
The value of exports to Switzerland were 8.4 percent higher than in Juli of the previous year, thus amounting to €212 million. The largest product groups of exports were: Sitc 971 (gold,non-monetary), which represented a share of 82.6 per cent of total exports, Sitc 682 (copper) 1.2 % and Sitc 771 (electric power machinery (other than rotating electric plant of group 716) and parts thereof) 1.0 % of the exports.

| Year | Month | Import 1,000 € | Export 1,000 € | Trade 1,000 € | Trade Balance 1,000 € |
|---|---|---|---|---|---|
| 2023 | 1 | 59,647 | 124,790 | 184,437 | 65,143 |
| 2023 | 2 | 51,818 | 118,809 | 170,626 | 66,991 |
| 2023 | 3 | 68,164 | 131,064 | 199,228 | 62,900 |
| 2023 | 4 | 61,894 | 89,082 | 150,977 | 27,188 |
| 2023 | 5 | 57,767 | 126,743 | 184,511 | 68,976 |
| 2023 | 6 | 56,652 | 133,842 | 190,494 | 77,190 |
| 2023 | 7 | 50,207 | 86,401 | 136,608 | 36,193 |
| 2023 | 8 | 49,139 | 146,806 | 195,945 | 97,667 |
| 2023 | 9 | 58,259 | 113,640 | 171,899 | 55,381 |
| 2023 | 10 | 58,223 | 131,609 | 189,832 | 73,386 |
| 2023 | 11 | 61,439 | 125,766 | 187,205 | 64,326 |
| 2023 | 12 | 58,320 | 115,796 | 174,116 | 57,476 |
| 2024 | 1 | 67,431 | 128,051 | 195,482 | 60,619 |
| 2024 | 2 | 56,836 | 94,464 | 151,300 | 37,629 |
| 2024 | 3 | 51,026 | 116,922 | 167,949 | 65,896 |
| 2024 | 4 | 58,830 | 141,733 | 200,563 | 82,903 |
| 2024 | 5 | 66,116 | 163,494 | 229,610 | 97,379 |
| 2024 | 6 | 48,975 | 108,397 | 157,372 | 59,422 |
| 2024 | 7 | 62,191 | 181,306 | 243,497 | 119,115 |
| 2024 | 8 | 47,285 | 146,989 | 194,273 | 99,704 |
| 2024 | 9 | 63,520 | 171,680 | 235,200 | 108,160 |
| 2024 | 10 | 62,870 | 81,282 | 144,152 | 18,411 |
| 2024 | 11 | 54,050 | 156,071 | 210,120 | 102,021 |
| 2024 | 12 | 52,163 | 97,573 | 149,736 | 45,410 |
| 2025 | 1 | 45,606 | 121,934 | 167,540 | 76,328 |
| 2025 | 2 | 51,724 | 121,512 | 173,236 | 69,788 |
| 2025 | 3 | 63,048 | 168,425 | 231,473 | 105,377 |
| 2025 | 4 | 64,469 | 157,915 | 222,385 | 93,446 |
| 2025 | 5 | 50,784 | 179,305 | 230,089 | 128,520 |
| 2025 | 6 | 54,158 | 160,384 | 214,543 | 106,226 |
| 2025 | 7 | 59,441 | 195,499 | 254,939 | 136,058 |
| 2025 | 8 | 49,477 | 174,770 | 224,248 | 125,293 |
| 2025 | 9 | 53,137 | 174,462 | 227,599 | 121,325 |
| 2025 | 10 | 65,361 | 208,106 | 273,468 | 142,745 |
| 2025 | 11 | 57,778 | 212,870 | 270,649 | 155,092 |
| 2025 | 12 | 64,577 | 269,309 | 333,886 | 204,732 |
| 2026 | 1 | 50,397 | 251,834 | 302,231 | 201,437 |
| 2026 | 2 | 54,572 | 224,904 | 279,476 | 170,332 |
| 2026 | 3 | 62,423 | 279,891 | 342,314 | 217,468 |
| 2026 | 4 | 57,718 | 285,671 | 343,389 | 227,954 |
| 2026 | 5 | 66,226 | 232,012 | 298,238 | 165,786 |
| 2026 | 6 | 78,663 | 270,410 | 349,073 | 191,747 |
| 2026 | 7 | 66,607 | 211,959 | 278,567 | 145,352 |
| 2026/3 | 2026/4 | 2026/5 | 2026/6 | 2026/7 | ||||||
|---|---|---|---|---|---|---|---|---|---|---|
| 1000 € | % | 1000 € | % | 1000 € | % | 1000 € | % | 1000 € | % | |
| 0. Food and live animals | 1,192 | 0.4 | 2,087 | 0.7 | 1,798 | 0.8 | 1,395 | 0.5 | 1,095 | 0.5 |
| 1. Beverages and tobacco | 59 | 0.0 | 82 | 0.0 | 66 | 0.0 | 43 | 0.0 | 50 | 0.0 |
| 2. Crude materials,inedible,except fuels | 6,880 | 2.5 | 4,113 | 1.4 | 4,179 | 1.8 | 10,855 | 4.0 | 2,447 | 1.2 |
| 3. Mineral fuels etc | 1 | 0.0 | 10 | 0.0 | 2 | 0.0 | 2 | 0.0 | 12 | 0.0 |
| 4. Animal and vegetable oils and fats | 31 | 0.0 | 63 | 0.0 | 31 | 0.0 | 84 | 0.0 | 26 | 0.0 |
| 5. Chemicals and related products,n.e.s. | 6,373 | 2.3 | 5,244 | 1.8 | 4,067 | 1.8 | 5,721 | 2.1 | 3,870 | 1.8 |
| 6. Basic manufactures | 22,177 | 7.9 | 5,373 | 1.9 | 6,271 | 2.7 | 8,292 | 3.1 | 12,659 | 6.0 |
| 7. Machinery,transport equipment | 10,870 | 3.9 | 13,932 | 4.9 | 16,742 | 7.2 | 11,363 | 4.2 | 11,793 | 5.6 |
| 8. Miscellaneous manufactured articles | 3,789 | 1.4 | 3,707 | 1.3 | 4,259 | 1.8 | 4,988 | 1.8 | 4,883 | 2.3 |
| 9. Goods not classified elsewhere | 228,520 | 81.6 | 251,059 | 87.9 | 194,596 | 83.9 | 227,666 | 84.2 | 175,126 | 82.6 |
| All groups combined | 279,891 | 100.0 | 285,671 | 100.0 | 232,012 | 100.0 | 270,410 | 100.0 | 211,959 | 100.0 |

| 2026/3 | 2026/4 | 2026/5 | 2026/6 | 2026/7 | ||||||
|---|---|---|---|---|---|---|---|---|---|---|
| 1000 € | % | 1000 € | % | 1000 € | % | 1000 € | % | 1000 € | % | |
| 0. Food and live animals | 2,020 | 3.2 | 2,220 | 3.8 | 2,366 | 3.6 | 2,831 | 3.6 | 4,326 | 6.5 |
| 1. Beverages and tobacco | 234 | 0.4 | 148 | 0.3 | 41 | 0.1 | 337 | 0.4 | 155 | 0.2 |
| 2. Crude materials,inedible,except fuels | 263 | 0.4 | 346 | 0.6 | 252 | 0.4 | 145 | 0.2 | 457 | 0.7 |
| 3. Mineral fuels etc | 56 | 0.1 | 90 | 0.2 | 42 | 0.1 | 41 | 0.1 | 103 | 0.2 |
| 4. Animal and vegetable oils and fats | 1 | 0.0 | ||||||||
| 5. Chemicals and related products,n.e.s. | 22,246 | 35.6 | 15,627 | 27.1 | 23,850 | 36.0 | 21,506 | 27.3 | 16,385 | 24.6 |
| 6. Basic manufactures | 5,208 | 8.3 | 9,090 | 15.7 | 10,006 | 15.1 | 17,058 | 21.7 | 10,455 | 15.7 |
| 7. Machinery,transport equipment | 22,447 | 36.0 | 19,087 | 33.1 | 17,676 | 26.7 | 26,170 | 33.3 | 26,349 | 39.6 |
| 8. Miscellaneous manufactured articles | 9,113 | 14.6 | 10,507 | 18.2 | 11,618 | 17.5 | 10,146 | 12.9 | 8,341 | 12.5 |
| 9. Goods not classified elsewhere | 836 | 1.3 | 603 | 1.0 | 375 | 0.6 | 429 | 0.5 | 37 | 0.1 |
| All groups combined | 62,423 | 100.0 | 57,718 | 100.0 | 66,226 | 100.0 | 78,663 | 100.0 | 66,607 | 100.0 |
| Classification | Description | Year level | Quarter level | Month level | Year 2026 sofar |
|---|---|---|---|---|---|
| SITC | Standard International Trade Classification (classification system is maintained by the United Nations) | ███ | ███ | ███ | ███ |
| BEC | The standard of statistical classification of BEC (Broad Economic Categories) is upheld by the UN and it is based on SITC-nomenclature. | ███ | ███ | ███ | ███ |
| NACE | National industrial classification based on Statistical Classification of Economic Activities in the European Community Nomenclature générale des Activités économiques dans les Communautés européennes | ███ | ███ | ███ | ███ |
| CPA | CPA = Classification of Products by Activities | ███ | ███ | ███ | ███ |
| CN | The Combined Nomenclature is the common nomenclature of the European Community. | ███ | ███ | ███ | ███ |