
| Export of goods from Finland and import to Finland | Trade Balance |

| Year | Import 1,000 € | Export 1,000 € | Trade 1,000 € | Trade balance 1,000 € |
|---|---|---|---|---|
| 2002 | 8,992 | 50,695 | 59,687 | 41,703 |
| 2003 | 5,149 | 53,059 | 58,209 | 47,910 |
| 2004 | 6,277 | 57,985 | 64,262 | 51,707 |
| 2005 | 7,926 | 46,969 | 54,895 | 39,043 |
| 2006 | 6,886 | 47,162 | 54,048 | 40,275 |
| 2007 | 5,716 | 65,348 | 71,064 | 59,632 |
| 2008 | 16,743 | 59,274 | 76,018 | 42,531 |
| 2009 | 11,006 | 42,833 | 53,839 | 31,827 |
| 2010 | 8,738 | 53,768 | 62,506 | 45,029 |
| 2011 | 8,290 | 48,660 | 56,950 | 40,370 |
| 2012 | 7,667 | 46,086 | 53,753 | 38,418 |
| 2013 | 8,586 | 50,658 | 59,244 | 42,071 |
| 2014 | 15,396 | 45,862 | 61,258 | 30,466 |
| 2015 | 14,455 | 44,270 | 58,725 | 29,814 |
| 2016 | 12,570 | 41,572 | 54,142 | 29,002 |
| 2017 | 15,450 | 42,458 | 57,908 | 27,008 |
| 2018 | 21,459 | 46,985 | 68,444 | 25,526 |
| 2019 | 12,883 | 43,699 | 56,582 | 30,816 |
| 2020 | 11,001 | 33,208 | 44,209 | 22,206 |
| 2021 | 13,224 | 54,876 | 68,099 | 41,652 |
| 2022 | 13,756 | 54,466 | 68,221 | 40,710 |
| 2023 | 16,075 | 40,516 | 56,591 | 24,441 |
| 2024 | 21,434 | 46,144 | 67,578 | 24,710 |
| 2025 | 24,500 | 42,636 | 67,136 | 18,137 |
*) SITC = Standard International Trade Classification (classification system is maintained by the United Nations)
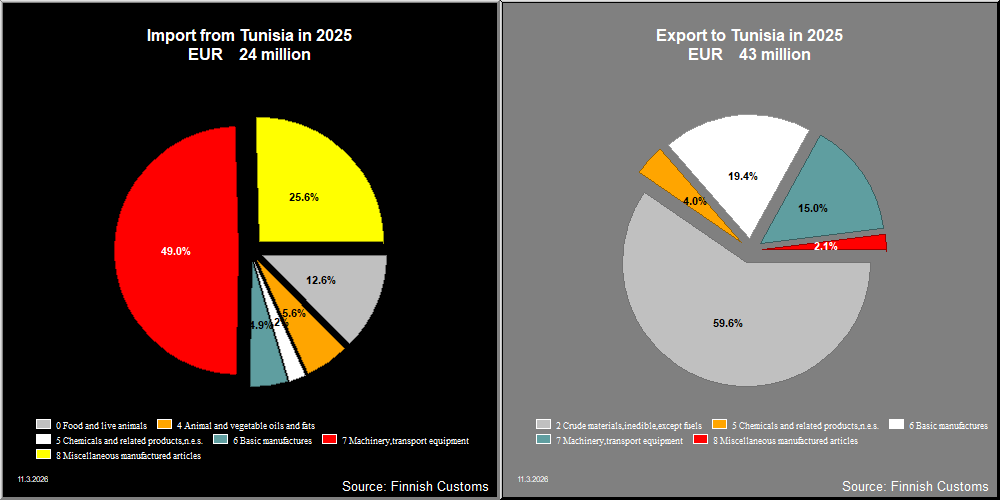

| 2021 | 2022 | 2023 | 2024 | 2025 | ||||||
|---|---|---|---|---|---|---|---|---|---|---|
| 1,000 € | % | 1,000 € | % | 1,000 € | % | 1,000 € | % | 1,000 € | % | |
| 0. Food and live animals | 5,581 | 10.2 | ||||||||
| 04. Cereals and cereal preparations | 5,581 | 10.2 | ||||||||
| 2. Crude materials,inedible,except fuels | 32,548 | 59.3 | 33,018 | 60.6 | 25,113 | 62.0 | 30,851 | 66.9 | 25,398 | 59.6 |
| 24. Cork and wood | 23,089 | 42.1 | 22,787 | 41.8 | 18,491 | 45.6 | 17,853 | 38.7 | 18,929 | 44.4 |
| 25. Pulp and waste paper | 9,388 | 17.1 | 10,060 | 18.5 | 6,596 | 16.3 | 12,948 | 28.1 | 6,434 | 15.1 |
| 26. Textile fibres and their wastes | 10 | 0.0 | ||||||||
| 27. Crude fertilizers and crude minerals | 71 | 0.1 | 171 | 0.3 | 27 | 0.1 | 40 | 0.1 | 35 | 0.1 |
| 5. Chemicals and related products,n.e.s. | 1,416 | 2.6 | 2,438 | 4.5 | 2,141 | 5.3 | 2,284 | 5.0 | 1,688 | 4.0 |
| 51. Organic chemicals | 85 | 0.2 | 23 | 0.0 | 222 | 0.5 | 474 | 1.0 | 238 | 0.6 |
| 52. Inorganic chemicals | 12 | 0.0 | 9 | 0.0 | 21 | 0.1 | 11 | 0.0 | 21 | 0.1 |
| 53. Dyeing,tanning and colouring material | 106 | 0.2 | ||||||||
| 54. Medicinal and pharmaceutical products | 90 | 0.2 | 93 | 0.2 | 57 | 0.1 | ||||
| 55. Perfume,cleaning etc.preparations | 13 | 0.0 | 1 | 0.0 | 1 | 0.0 | ||||
| 57. Plastics in primary forms | 513 | 0.9 | 1,256 | 2.3 | 557 | 1.4 | 687 | 1.5 | 347 | 0.8 |
| 58. Plastics in non-primary forms | 277 | 0.5 | 853 | 1.6 | 788 | 1.9 | 544 | 1.2 | 562 | 1.3 |
| 59. Chemical materials and products,n.e.s. | 334 | 0.6 | 285 | 0.5 | 458 | 1.1 | 511 | 1.1 | 519 | 1.2 |
| 6. Basic manufactures | 12,674 | 23.1 | 15,407 | 28.3 | 9,537 | 23.5 | 8,652 | 18.8 | 8,267 | 19.4 |
| 62. Rubber manufactures,n.e.s. | 109 | 0.2 | 82 | 0.2 | 80 | 0.2 | 66 | 0.1 | 28 | 0.1 |
| 63. Wood and cork manufactures | 234 | 0.4 | 6 | 0.0 | ||||||
| 64. Paper,paperboard and articles thereof | 10,458 | 19.1 | 13,979 | 25.7 | 8,637 | 21.3 | 7,415 | 16.1 | 7,144 | 16.8 |
| 65. Textile yarn,fabrics,made up articles,etc. | 465 | 0.8 | 646 | 1.2 | 683 | 1.7 | 1,048 | 2.3 | 1,005 | 2.4 |
| 66. Non-metallic mineral manufactures,n.e.s. | 10 | 0.0 | 23 | 0.0 | 50 | 0.1 | 93 | 0.2 | 72 | 0.2 |
| 67. Iron and steel | 1,072 | 2.0 | 502 | 0.9 | 5 | 0.0 | ||||
| 68. Non-ferrous metals | 179 | 0.3 | 167 | 0.3 | 6 | 0.0 | ||||
| 69. Manufactures of metals,n.e.s. | 147 | 0.3 | 2 | 0.0 | 88 | 0.2 | 24 | 0.1 | 12 | 0.0 |
| 7. Machinery,transport equipment | 2,066 | 3.8 | 2,929 | 5.4 | 2,624 | 6.5 | 2,893 | 6.3 | 6,402 | 15.0 |
| 71. Power generating machinery and equipment | 29 | 0.1 | 29 | 0.1 | 1,166 | 2.9 | 19 | 0.0 | 442 | 1.0 |
| 72. Machinery for specialized industries | 480 | 0.9 | 452 | 0.8 | 398 | 1.0 | 849 | 1.8 | 498 | 1.2 |
| 73. Metal working machinery | 22 | 0.0 | 36 | 0.1 | 87 | 0.2 | ||||
| 74. General industrial machinery n.e.s. | 106 | 0.2 | 813 | 1.5 | 88 | 0.2 | 678 | 1.5 | 273 | 0.6 |
| 75. Office machines and adp machines | 2 | 0.0 | 18 | 0.0 | 30 | 0.1 | 26 | 0.1 | 16 | 0.0 |
| 76. Telecommunications and sound recording equipment | 60 | 0.1 | 64 | 0.1 | 31 | 0.1 | 20 | 0.0 | 9 | 0.0 |
| 77. Electric machinery,n.e.s.and parts | 838 | 1.5 | 1,208 | 2.2 | 767 | 1.9 | 834 | 1.8 | 974 | 2.3 |
| 78. Road vehicles | 529 | 1.0 | 309 | 0.6 | 144 | 0.4 | 334 | 0.7 | 207 | 0.5 |
| 79. Other transport equipment | 46 | 0.1 | 3,984 | 9.3 | ||||||
| 8. Miscellaneous manufactured articles | 589 | 1.1 | 673 | 1.2 | 1,101 | 2.7 | 1,433 | 3.1 | 880 | 2.1 |
| 81. Prefabr.buildings;sanitary,lighting etc.fixtrs | 1 | 0.0 | 4 | 0.0 | 225 | 0.6 | 1 | 0.0 | ||
| 82. Furniture and parts thereof | 29 | 0.1 | 10 | 0.0 | ||||||
| 87. Instruments and apparates n.e.s. | 504 | 0.9 | 599 | 1.1 | 860 | 2.1 | 1,240 | 2.7 | 852 | 2.0 |
| 88. Photographic equipment,optical goods etc. | 11 | 0.0 | 1 | 0.0 | 1 | 0.0 | ||||
| 89. Miscellaneous manufactured articles,n.e.s. | 73 | 0.1 | 40 | 0.1 | 16 | 0.0 | 181 | 0.4 | 29 | 0.1 |
| All groups combined | 54,876 | 100.0 | 54,466 | 100.0 | 40,516 | 100.0 | 46,113 | 100.0 | 42,636 | 100.0 |
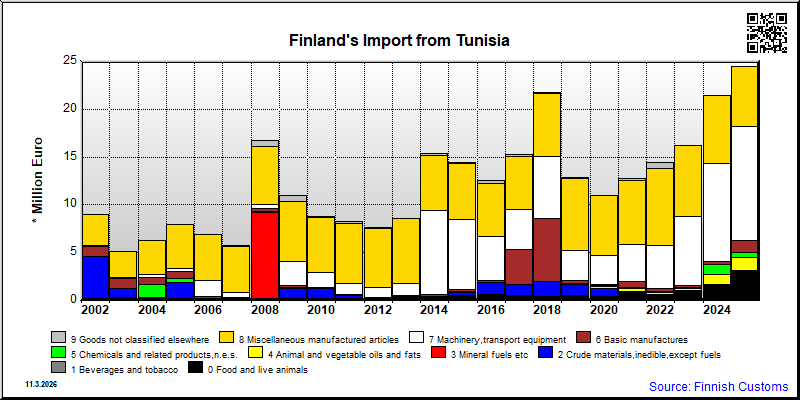
| 2021 | 2022 | 2023 | 2024 | 2025 | ||||||
|---|---|---|---|---|---|---|---|---|---|---|
| 1,000 € | % | 1,000 € | % | 1,000 € | % | 1,000 € | % | 1,000 € | % | |
| 0. Food and live animals | 885 | 6.9 | 658 | 4.5 | 1,013 | 6.3 | 1,700 | 7.9 | 3,091 | 12.6 |
| 03. Fish and fish preparations | 11 | 0.1 | 1 | 0.0 | 1 | 0.0 | 1 | 0.0 | ||
| 04. Cereals and cereal preparations | 2 | 0.0 | 3 | 0.0 | 9 | 0.1 | 14 | 0.1 | 3 | 0.0 |
| 05. Vegetables and fruit | 864 | 6.8 | 644 | 4.4 | 970 | 6.0 | 1,362 | 6.3 | 2,406 | 9.8 |
| 06. Sugars,sugar preparations and honey | 1 | 0.0 | 51 | 0.2 | 108 | 0.4 | ||||
| 09. Miscellaneous edible products and preparations | 8 | 0.1 | 10 | 0.1 | 32 | 0.2 | 273 | 1.3 | 573 | 2.3 |
| 2. Crude materials,inedible,except fuels | 106 | 0.8 | 7 | 0.0 | 3 | 0.0 | 4 | 0.0 | 6 | 0.0 |
| 22. Oil seeds,oleaginous fruits | 2 | 0.0 | ||||||||
| 27. Crude fertilizers and crude minerals | 106 | 0.8 | 5 | 0.0 | 2 | 0.0 | 3 | 0.0 | 3 | 0.0 |
| 29. Crude animal,vegetable materials n.e.s. | 1 | 0.0 | 1 | 0.0 | 1 | 0.0 | ||||
| 4. Animal and vegetable oils and fats | 230 | 1.8 | 190 | 1.3 | 255 | 1.6 | 993 | 4.6 | 1,376 | 5.6 |
| 42. Fixed vegetable fats and oils | 230 | 1.8 | 190 | 1.3 | 255 | 1.6 | 993 | 4.6 | 1,376 | 5.6 |
| 5. Chemicals and related products,n.e.s. | 140 | 1.1 | 102 | 0.7 | 129 | 0.8 | 1,085 | 5.1 | 548 | 2.2 |
| 52. Inorganic chemicals | 905 | 4.2 | 402 | 1.6 | ||||||
| 53. Dyeing,tanning and colouring material | 6 | 0.0 | 3 | 0.0 | ||||||
| 54. Medicinal and pharmaceutical products | 40 | 0.3 | 89 | 0.6 | 88 | 0.5 | 102 | 0.5 | 74 | 0.3 |
| 55. Perfume,cleaning etc.preparations | 1 | 0.0 | 3 | 0.0 | 26 | 0.2 | 31 | 0.1 | 44 | 0.2 |
| 57. Plastics in primary forms | 1 | 0.0 | ||||||||
| 58. Plastics in non-primary forms | 98 | 0.8 | 6 | 0.0 | 14 | 0.1 | 39 | 0.2 | 24 | 0.1 |
| 59. Chemical materials and products,n.e.s. | 4 | 0.0 | 1 | 0.0 | 1 | 0.0 | ||||
| 6. Basic manufactures | 607 | 4.8 | 314 | 2.2 | 202 | 1.2 | 278 | 1.3 | 1,207 | 4.9 |
| 61. Leather,dressed fur,etc. | 1 | 0.0 | 1 | 0.0 | ||||||
| 62. Rubber manufactures,n.e.s. | 17 | 0.1 | 29 | 0.2 | 23 | 0.1 | 25 | 0.1 | 34 | 0.1 |
| 63. Wood and cork manufactures | 7 | 0.0 | 5 | 0.0 | ||||||
| 64. Paper,paperboard and articles thereof | 5 | 0.0 | 3 | 0.0 | ||||||
| 65. Textile yarn,fabrics,made up articles,etc. | 427 | 3.3 | 113 | 0.8 | 102 | 0.6 | 108 | 0.5 | 127 | 0.5 |
| 66. Non-metallic mineral manufactures,n.e.s. | 3 | 0.0 | 44 | 0.2 | 951 | 3.9 | ||||
| 67. Iron and steel | 1 | 0.0 | ||||||||
| 68. Non-ferrous metals | 1 | 0.0 | 1 | 0.0 | 2 | 0.0 | ||||
| 69. Manufactures of metals,n.e.s. | 158 | 1.2 | 173 | 1.2 | 67 | 0.4 | 96 | 0.4 | 83 | 0.3 |
| 7. Machinery,transport equipment | 3,886 | 30.4 | 4,441 | 30.7 | 7,161 | 44.2 | 10,285 | 47.9 | 12,000 | 49.0 |
| 71. Power generating machinery and equipment | 354 | 2.8 | 502 | 3.5 | 532 | 3.3 | 478 | 2.2 | 562 | 2.3 |
| 72. Machinery for specialized industries | 6 | 0.0 | 7 | 0.0 | 8 | 0.1 | 7 | 0.0 | 6 | 0.0 |
| 73. Metal working machinery | 3 | 0.0 | 3 | 0.0 | ||||||
| 74. General industrial machinery n.e.s. | 981 | 7.7 | 806 | 5.6 | 1,298 | 8.0 | 2,621 | 12.2 | 2,422 | 9.9 |
| 75. Office machines and adp machines | 6 | 0.0 | 2 | 0.0 | 3 | 0.0 | 2 | 0.0 | ||
| 76. Telecommunications and sound recording equipment | 134 | 1.1 | 108 | 0.7 | 2,639 | 16.3 | 4,255 | 19.8 | 2,235 | 9.1 |
| 77. Electric machinery,n.e.s.and parts | 2,105 | 16.5 | 2,678 | 18.5 | 2,246 | 13.9 | 2,661 | 12.4 | 6,390 | 26.1 |
| 78. Road vehicles | 299 | 2.3 | 335 | 2.3 | 398 | 2.5 | 253 | 1.2 | 369 | 1.5 |
| 79. Other transport equipment | 34 | 0.2 | 9 | 0.0 | 15 | 0.1 | ||||
| 8. Miscellaneous manufactured articles | 6,693 | 52.4 | 8,097 | 56.0 | 7,434 | 45.9 | 7,122 | 33.2 | 6,257 | 25.5 |
| 81. Prefabr.buildings;sanitary,lighting etc.fixtrs | 66 | 0.5 | 57 | 0.4 | 18 | 0.1 | 4 | 0.0 | 4 | 0.0 |
| 82. Furniture and parts thereof | 3 | 0.0 | 5 | 0.0 | 3 | 0.0 | 1 | 0.0 | 42 | 0.2 |
| 83. Travel goods,handbags and sim.containers | 80 | 0.6 | 54 | 0.4 | 73 | 0.4 | 93 | 0.4 | 260 | 1.1 |
| 84. Articles of apparel and clothing accessories | 4,658 | 36.5 | 5,898 | 40.8 | 5,407 | 33.4 | 4,884 | 22.7 | 4,025 | 16.4 |
| 85. Footwear | 212 | 1.7 | 182 | 1.3 | 199 | 1.2 | 134 | 0.6 | 148 | 0.6 |
| 87. Instruments and apparates n.e.s. | 1,263 | 9.9 | 1,414 | 9.8 | 1,357 | 8.4 | 1,243 | 5.8 | 1,012 | 4.1 |
| 88. Photographic equipment,optical goods etc. | 2 | 0.0 | 1 | 0.0 | 4 | 0.0 | 1 | 0.0 | 2 | 0.0 |
| 89. Miscellaneous manufactured articles,n.e.s. | 409 | 3.2 | 485 | 3.4 | 374 | 2.3 | 762 | 3.5 | 763 | 3.1 |
| 9. Goods not classified elsewhere | 219 | 1.7 | 661 | 4.6 | 2 | 0.0 | 2 | 0.0 | 4 | 0.0 |
| 93. Special transactions and commodities not classified | 219 | 1.7 | 661 | 4.6 | 2 | 0.0 | 2 | 0.0 | 4 | 0.0 |
| All groups combined | 12,765 | 100.0 | 14,470 | 100.0 | 16,199 | 100.0 | 21,468 | 100.0 | 24,488 | 100.0 |
| Classification | Description | Year level | Quarter level | Month level | |
|---|---|---|---|---|---|
| SITC | Standard International Trade Classification (classification system is maintained by the United Nations) | ███ | ███ | ███ | |
| BEC | The standard of statistical classification of BEC (Broad Economic Categories) is upheld by the UN and it is based on SITC-nomenclature. | ███ | ███ | ███ | |
| NACE | National industrial classification based on Statistical Classification of Economic Activities in the European Community Nomenclature générale des Activités économiques dans les Communautés européennes | ███ | ███ | ███ | |
| CPA | CPA = Classification of Products by Activities | ███ | ███ | ███ | |
| CN | The Combined Nomenclature is the common nomenclature of the European Community. | ███ | ███ | ███ |