
| Export of goods from Finland and import to Finland | Trade Balance |

| Import 1,000 € | Export 1,000 € | Trade 1,000 € | Trade Balance 1,000 € | |
|---|---|---|---|---|
| 2019 Q1 | 6,870 | 7,581 | 14,451 | 711 |
| 2019 Q2 | 9,734 | 7,036 | 16,769 | -2,698 |
| 2019 Q3 | 2,195 | 5,430 | 7,625 | 3,236 |
| 2019 Q4 | 4,017 | 5,559 | 9,576 | 1,541 |
| 2020 Q1 | 3,776 | 8,596 | 12,372 | 4,820 |
| 2020 Q2 | 2,034 | 8,032 | 10,065 | 5,998 |
| 2020 Q3 | 2,397 | 6,550 | 8,947 | 4,153 |
| 2020 Q4 | 2,747 | 6,510 | 9,257 | 3,763 |
| 2021 Q1 | 1,407 | 4,280 | 5,687 | 2,872 |
| 2021 Q2 | 4,051 | 5,915 | 9,966 | 1,864 |
| 2021 Q3 | 4,064 | 5,176 | 9,240 | 1,112 |
| 2021 Q4 | 14,923 | 8,684 | 23,607 | -6,238 |
| 2022 Q1 | 4,800 | 8,452 | 13,252 | 3,653 |
| 2022 Q2 | 21,426 | 9,015 | 30,441 | -12,411 |
| 2022 Q3 | 59,409 | 10,606 | 70,015 | -48,803 |
| 2022 Q4 | 88,811 | 9,983 | 98,794 | -78,827 |
| 2023 Q1 | 2,220 | 6,799 | 9,020 | 4,579 |
| 2023 Q2 | 5,622 | 7,619 | 13,241 | 1,998 |
| 2023 Q3 | 58,879 | 8,275 | 67,154 | -50,604 |
| 2023 Q4 | 72,186 | 5,560 | 77,746 | -66,626 |
| 2024 Q1 | 43,313 | 7,397 | 50,710 | -35,916 |
| 2024 Q2 | 59,167 | 4,034 | 63,202 | -55,133 |
| 2024 Q3 | 63,317 | 5,196 | 68,513 | -58,121 |
| 2024 Q4 | 16,034 | 8,206 | 24,240 | -7,828 |
| 2025 Q1 | 28,392 | 6,528 | 34,920 | -21,864 |
| 2025 Q2 | 46,807 | 5,354 | 52,161 | -41,452 |
| 2025 Q3 | 64,943 | 5,480 | 70,423 | -59,463 |
| 2025 Q4 | 58,512 | 5,232 | 63,743 | -53,280 |
| 2026 Q1 | 33,478 | 4,906 | 38,384 | -28,571 |
| 2026 Q2 | 18,286 | 3,956 | 22,243 | -14,330 |

| Q2 / 2026 | Q2 / 2025 | Muutos edellisestä vastaavasta kaudesta % | ||
|---|---|---|---|---|
| 1,000 € | % | 1,000 € | ||
| 0. Food and live animals | 42 | 1.1 | 39 | 8.5 |
| 1. Beverages and tobacco | 0 | 0.0 | 0 | .. |
| 2. Crude materials,inedible,except fuels | 1 | 0.0 | 71 | -99.3 |
| 5. Chemicals and related products,n.e.s. | 92 | 2.3 | 203 | -54.6 |
| 6. Basic manufactures | 152 | 3.8 | 485 | -68.7 |
| 7. Machinery,transport equipment | 2,828 | 71.5 | 3,735 | -24.3 |
| 8. Miscellaneous manufactured articles | 841 | 21.3 | 823 | 2.3 |
| All groups combined | 3,956 | 100.0 | 5,354 | -26.1 |
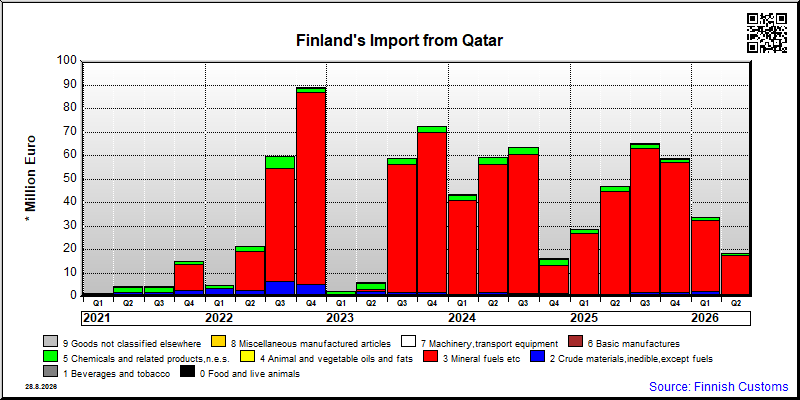
| Q2 / 2026 | Q2 / 2025 | Muutos edellisestä vastaavasta kaudesta % | ||
|---|---|---|---|---|
| 1,000 € | % | 1,000 € | ||
| 0. Food and live animals | 0 | 0 | 0 | .. |
| 2. Crude materials,inedible,except fuels | 894 | 4.9 | 0 | .. |
| 3. Mineral fuels etc | 16,376 | 89.6 | 44,789 | -63.4 |
| 5. Chemicals and related products,n.e.s. | 1,012 | 5.5 | 2,006 | -49.5 |
| 6. Basic manufactures | 0 | 0.0 | 7 | -96.5 |
| 7. Machinery,transport equipment | 2 | 0.0 | 1 | 60.0 |
| 8. Miscellaneous manufactured articles | 3 | 0.0 | 2 | 10.1 |
| 9. Goods not classified elsewhere | 0 | 0.0 | 2 | -95.6 |
| All groups combined | 18,286 | 100.0 | 46,807 | -60.9 |
| Classification | Description | Year level | Quarter level | Month level | Year 2026 sofar |
|---|---|---|---|---|---|
| SITC | Standard International Trade Classification (classification system is maintained by the United Nations) | ███ | ███ | ███ | ███ |
| BEC | The standard of statistical classification of BEC (Broad Economic Categories) is upheld by the UN and it is based on SITC-nomenclature. | ███ | ███ | ███ | ███ |
| NACE | National industrial classification based on Statistical Classification of Economic Activities in the European Community Nomenclature générale des Activités économiques dans les Communautés européennes | ███ | ███ | ███ | ███ |
| CPA | CPA = Classification of Products by Activities | ███ | ███ | ███ | ███ |
| CN | The Combined Nomenclature is the common nomenclature of the European Community. | ███ | ███ | ███ | ███ |