
| Export of goods from Finland and import to Finland | Trade Balance |

| Import 1,000 € | Export 1,000 € | Trade 1,000 € | Trade Balance 1,000 € | |
|---|---|---|---|---|
| 2019 Q1 | 14,656 | 9,890 | 24,546 | -4,767 |
| 2019 Q2 | 15,533 | 13,378 | 28,911 | -2,155 |
| 2019 Q3 | 18,324 | 10,561 | 28,885 | -7,762 |
| 2019 Q4 | 15,056 | 11,432 | 26,488 | -3,624 |
| 2020 Q1 | 16,349 | 12,854 | 29,202 | -3,495 |
| 2020 Q2 | 10,922 | 6,969 | 17,891 | -3,952 |
| 2020 Q3 | 16,516 | 11,914 | 28,429 | -4,602 |
| 2020 Q4 | 14,673 | 13,717 | 28,390 | -955 |
| 2021 Q1 | 14,523 | 17,033 | 31,556 | 2,510 |
| 2021 Q2 | 15,783 | 23,670 | 39,453 | 7,887 |
| 2021 Q3 | 15,417 | 34,142 | 49,559 | 18,726 |
| 2021 Q4 | 15,326 | 33,349 | 48,675 | 18,024 |
| 2022 Q1 | 16,819 | 19,221 | 36,041 | 2,402 |
| 2022 Q2 | 18,211 | 24,526 | 42,736 | 6,315 |
| 2022 Q3 | 22,760 | 30,837 | 53,596 | 8,077 |
| 2022 Q4 | 21,498 | 21,917 | 43,415 | 420 |
| 2023 Q1 | 19,276 | 9,999 | 29,275 | -9,277 |
| 2023 Q2 | 14,838 | 12,078 | 26,916 | -2,760 |
| 2023 Q3 | 16,366 | 12,815 | 29,182 | -3,551 |
| 2023 Q4 | 14,975 | 13,517 | 28,491 | -1,458 |
| 2024 Q1 | 13,484 | 6,604 | 20,088 | -6,881 |
| 2024 Q2 | 16,457 | 11,618 | 28,074 | -4,839 |
| 2024 Q3 | 18,368 | 9,351 | 27,719 | -9,016 |
| 2024 Q4 | 18,937 | 10,815 | 29,752 | -8,123 |
| 2025 Q1 | 16,917 | 11,659 | 28,576 | -5,258 |
| 2025 Q2 | 15,949 | 10,365 | 26,314 | -5,585 |
| 2025 Q3 | 20,416 | 10,278 | 30,694 | -10,138 |
| 2025 Q4 | 19,117 | 14,581 | 33,699 | -4,536 |
| 2026 Q1 | 22,361 | 16,942 | 39,303 | -5,419 |
| 2026 Q2 | 20,904 | 46,880 | 67,784 | 25,976 |

| Q2 / 2026 | Q2 / 2025 | Muutos edellisestä vastaavasta kaudesta % | ||
|---|---|---|---|---|
| 1,000 € | % | 1,000 € | ||
| 0. Food and live animals | 27 | 0.1 | 63 | -57.0 |
| 2. Crude materials,inedible,except fuels | 6,762 | 14.4 | 3,752 | 80.3 |
| 3. Mineral fuels etc | 0 | 0 | 0 | .. |
| 5. Chemicals and related products,n.e.s. | 103 | 0.2 | 1,803 | -94.3 |
| 6. Basic manufactures | 1,583 | 3.4 | 826 | 91.6 |
| 7. Machinery,transport equipment | 38,074 | 81.2 | 3,770 | 910.1 |
| 8. Miscellaneous manufactured articles | 331 | 0.7 | 151 | 119.5 |
| All groups combined | 46,880 | 100.0 | 10,365 | 352.3 |
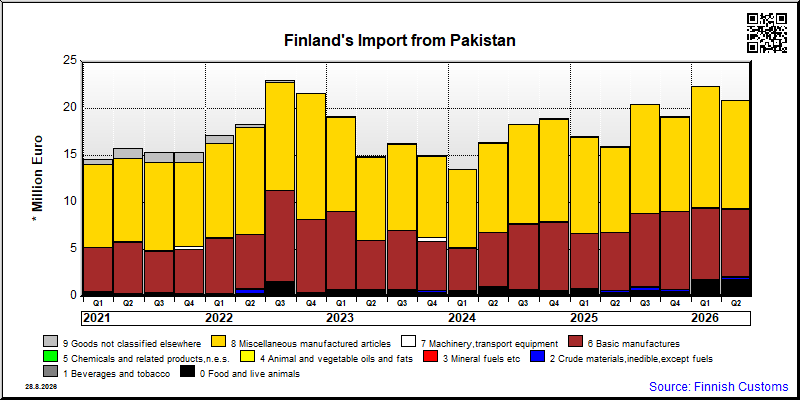
| Q2 / 2026 | Q2 / 2025 | Muutos edellisestä vastaavasta kaudesta % | ||
|---|---|---|---|---|
| 1,000 € | % | 1,000 € | ||
| 0. Food and live animals | 1,767 | 8.5 | 470 | 276.1 |
| 1. Beverages and tobacco | 0 | 0 | 0 | .. |
| 2. Crude materials,inedible,except fuels | 237 | 1.1 | 153 | 54.6 |
| 4. Animal and vegetable oils and fats | 2 | 0.0 | 0 | .. |
| 5. Chemicals and related products,n.e.s. | 90 | 0.4 | 54 | 67.0 |
| 6. Basic manufactures | 7,189 | 34.4 | 6,156 | 16.8 |
| 7. Machinery,transport equipment | 34 | 0.2 | 13 | 159.0 |
| 8. Miscellaneous manufactured articles | 11,558 | 55.3 | 9,044 | 27.8 |
| 9. Goods not classified elsewhere | 28 | 0.1 | 40 | -29.6 |
| All groups combined | 20,904 | 100.0 | 15,930 | 31.2 |
| Classification | Description | Year level | Quarter level | Month level | Year 2026 sofar |
|---|---|---|---|---|---|
| SITC | Standard International Trade Classification (classification system is maintained by the United Nations) | ███ | ███ | ███ | ███ |
| BEC | The standard of statistical classification of BEC (Broad Economic Categories) is upheld by the UN and it is based on SITC-nomenclature. | ███ | ███ | ███ | ███ |
| NACE | National industrial classification based on Statistical Classification of Economic Activities in the European Community Nomenclature générale des Activités économiques dans les Communautés européennes | ███ | ███ | ███ | ███ |
| CPA | CPA = Classification of Products by Activities | ███ | ███ | ███ | ███ |
| CN | The Combined Nomenclature is the common nomenclature of the European Community. | ███ | ███ | ███ | ███ |