
| Export of goods from Finland and import to Finland | Trade Balance |
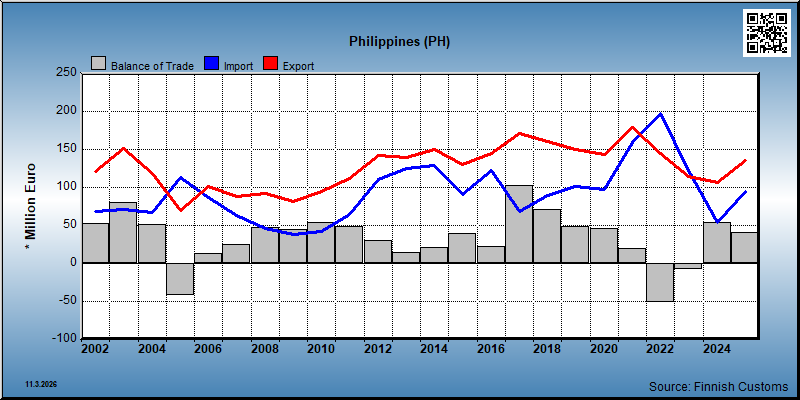
| Year | Import 1,000 € | Export 1,000 € | Trade 1,000 € | Trade balance 1,000 € |
|---|---|---|---|---|
| 2002 | 68,359 | 120,480 | 188,839 | 52,122 |
| 2003 | 70,614 | 151,427 | 222,041 | 80,813 |
| 2004 | 66,478 | 118,325 | 184,803 | 51,846 |
| 2005 | 112,647 | 70,254 | 182,901 | -42,392 |
| 2006 | 87,046 | 100,748 | 187,794 | 13,702 |
| 2007 | 63,246 | 87,923 | 151,169 | 24,677 |
| 2008 | 45,759 | 92,471 | 138,230 | 46,712 |
| 2009 | 37,688 | 81,801 | 119,489 | 44,112 |
| 2010 | 41,577 | 95,125 | 136,703 | 53,548 |
| 2011 | 64,021 | 112,253 | 176,274 | 48,232 |
| 2012 | 111,079 | 141,740 | 252,819 | 30,662 |
| 2013 | 124,644 | 139,077 | 263,721 | 14,433 |
| 2014 | 128,539 | 149,820 | 278,359 | 21,281 |
| 2015 | 91,142 | 130,649 | 221,791 | 39,506 |
| 2016 | 122,403 | 145,186 | 267,589 | 22,783 |
| 2017 | 68,278 | 171,556 | 239,835 | 103,278 |
| 2018 | 88,896 | 160,125 | 249,021 | 71,229 |
| 2019 | 101,103 | 149,560 | 250,663 | 48,457 |
| 2020 | 96,792 | 143,239 | 240,031 | 46,448 |
| 2021 | 159,781 | 179,363 | 339,144 | 19,582 |
| 2022 | 196,991 | 145,156 | 342,147 | -51,835 |
| 2023 | 121,762 | 114,442 | 236,204 | -7,320 |
| 2024 | 53,707 | 107,019 | 160,726 | 53,312 |
| 2025 | 94,220 | 135,050 | 229,270 | 40,830 |
*) SITC = Standard International Trade Classification (classification system is maintained by the United Nations)
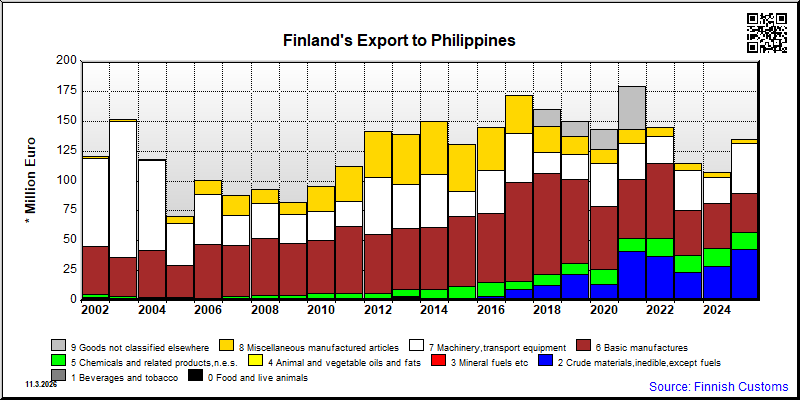
| 2021 | 2022 | 2023 | 2024 | 2025 | ||||||
|---|---|---|---|---|---|---|---|---|---|---|
| 1,000 € | % | 1,000 € | % | 1,000 € | % | 1,000 € | % | 1,000 € | % | |
| 0. Food and live animals | 335 | 0.2 | 609 | 0.4 | 1,044 | 0.9 | 1,188 | 1.1 | 1,521 | 1.1 |
| 00. Live animals | 1 | 0.0 | ||||||||
| 03. Fish and fish preparations | 33 | 0.0 | ||||||||
| 04. Cereals and cereal preparations | 14 | 0.0 | 21 | 0.0 | 17 | 0.0 | 23 | 0.0 | 133 | 0.1 |
| 05. Vegetables and fruit | 22 | 0.0 | 16 | 0.0 | 17 | 0.0 | 15 | 0.0 | 8 | 0.0 |
| 06. Sugars,sugar preparations and honey | 157 | 0.1 | 364 | 0.3 | 976 | 0.9 | 1,008 | 0.9 | 1,337 | 1.0 |
| 07. Coffee,tea,cocoa,spices | 30 | 0.0 | 172 | 0.1 | 33 | 0.0 | 142 | 0.1 | 43 | 0.0 |
| 09. Miscellaneous edible products and preparations | 113 | 0.1 | 3 | 0.0 | ||||||
| 1. Beverages and tobacco | 14 | 0.0 | ||||||||
| 11. Beverages | 14 | 0.0 | ||||||||
| 2. Crude materials,inedible,except fuels | 40,426 | 22.5 | 35,955 | 24.8 | 21,972 | 19.2 | 27,549 | 25.8 | 41,236 | 30.5 |
| 21. Hides,skins,furskins,raw | 83 | 0.1 | ||||||||
| 24. Cork and wood | 40,375 | 22.5 | 35,905 | 24.7 | 21,852 | 19.1 | 27,443 | 25.7 | 41,201 | 30.5 |
| 26. Textile fibres and their wastes | 28 | 0.0 | 21 | 0.0 | 14 | 0.0 | 9 | 0.0 | 19 | 0.0 |
| 27. Crude fertilizers and crude minerals | 16 | 0.0 | 17 | 0.0 | 14 | 0.0 | 89 | 0.1 | 15 | 0.0 |
| 29. Crude animal,vegetable materials n.e.s. | 6 | 0.0 | 12 | 0.0 | 9 | 0.0 | 9 | 0.0 | ||
| 5. Chemicals and related products,n.e.s. | 10,959 | 6.1 | 15,516 | 10.7 | 14,633 | 12.8 | 15,183 | 14.2 | 14,233 | 10.5 |
| 51. Organic chemicals | 133 | 0.1 | 166 | 0.1 | 27 | 0.0 | 1 | 0.0 | ||
| 52. Inorganic chemicals | 1 | 0.0 | 122 | 0.1 | 321 | 0.3 | 434 | 0.3 | ||
| 53. Dyeing,tanning and colouring material | 1 | 0.0 | 1 | 0.0 | ||||||
| 54. Medicinal and pharmaceutical products | 415 | 0.2 | 286 | 0.2 | 319 | 0.3 | 2,049 | 1.9 | 68 | 0.1 |
| 55. Perfume,cleaning etc.preparations | 19 | 0.0 | 28 | 0.0 | 17 | 0.0 | 18 | 0.0 | 15 | 0.0 |
| 56. Fertilizers,manufactured | 2 | 0.0 | 13 | 0.0 | 113 | 0.1 | ||||
| 57. Plastics in primary forms | 1,197 | 0.7 | 4,307 | 3.0 | 3,939 | 3.4 | 3,142 | 2.9 | 2,651 | 2.0 |
| 58. Plastics in non-primary forms | 29 | 0.0 | 22 | 0.0 | 54 | 0.0 | 483 | 0.5 | 1,342 | 1.0 |
| 59. Chemical materials and products,n.e.s. | 9,165 | 5.1 | 10,870 | 7.5 | 10,015 | 8.7 | 9,131 | 8.5 | 9,609 | 7.1 |
| 6. Basic manufactures | 49,816 | 27.8 | 62,880 | 43.3 | 37,878 | 33.1 | 37,095 | 34.7 | 32,482 | 24.1 |
| 62. Rubber manufactures,n.e.s. | 102 | 0.1 | 407 | 0.3 | 254 | 0.2 | 330 | 0.3 | 215 | 0.2 |
| 63. Wood and cork manufactures | 1,343 | 0.7 | 1,370 | 0.9 | 127 | 0.1 | 178 | 0.2 | 176 | 0.1 |
| 64. Paper,paperboard and articles thereof | 40,886 | 22.8 | 47,710 | 32.9 | 33,228 | 29.0 | 33,490 | 31.4 | 29,411 | 21.8 |
| 65. Textile yarn,fabrics,made up articles,etc. | 45 | 0.0 | 57 | 0.0 | 43 | 0.0 | 50 | 0.0 | 9 | 0.0 |
| 66. Non-metallic mineral manufactures,n.e.s. | 780 | 0.4 | 1,144 | 0.8 | 408 | 0.4 | 426 | 0.4 | 366 | 0.3 |
| 67. Iron and steel | 73 | 0.0 | 413 | 0.3 | 772 | 0.7 | 445 | 0.4 | 229 | 0.2 |
| 68. Non-ferrous metals | 5,397 | 3.0 | 10,386 | 7.2 | 1 | 0.0 | ||||
| 69. Manufactures of metals,n.e.s. | 1,189 | 0.7 | 1,394 | 1.0 | 3,046 | 2.7 | 2,175 | 2.0 | 2,076 | 1.5 |
| 7. Machinery,transport equipment | 29,886 | 16.7 | 22,372 | 15.4 | 33,318 | 29.1 | 21,955 | 20.6 | 41,678 | 30.9 |
| 71. Power generating machinery and equipment | 15,272 | 8.5 | 4,590 | 3.2 | 12,720 | 11.1 | 885 | 0.8 | 26,804 | 19.8 |
| 72. Machinery for specialized industries | 4,679 | 2.6 | 7,062 | 4.9 | 8,876 | 7.7 | 10,377 | 9.7 | 6,424 | 4.8 |
| 73. Metal working machinery | 66 | 0.0 | 66 | 0.0 | 65 | 0.1 | 35 | 0.0 | 211 | 0.2 |
| 74. General industrial machinery n.e.s. | 2,609 | 1.5 | 4,387 | 3.0 | 5,594 | 4.9 | 7,642 | 7.2 | 3,857 | 2.9 |
| 75. Office machines and adp machines | 80 | 0.0 | 152 | 0.1 | 212 | 0.2 | 268 | 0.3 | 44 | 0.0 |
| 76. Telecommunications and sound recording equipment | 236 | 0.1 | 197 | 0.1 | 289 | 0.3 | 127 | 0.1 | 93 | 0.1 |
| 77. Electric machinery,n.e.s.and parts | 5,607 | 3.1 | 3,773 | 2.6 | 3,952 | 3.5 | 2,615 | 2.4 | 2,521 | 1.9 |
| 78. Road vehicles | 221 | 0.1 | 12 | 0.0 | 741 | 0.6 | 1 | 0.0 | 1,100 | 0.8 |
| 79. Other transport equipment | 1,116 | 0.6 | 2,133 | 1.5 | 871 | 0.8 | 7 | 0.0 | 623 | 0.5 |
| 8. Miscellaneous manufactured articles | 11,349 | 6.3 | 7,822 | 5.4 | 5,668 | 4.9 | 3,842 | 3.6 | 3,900 | 2.9 |
| 81. Prefabr.buildings;sanitary,lighting etc.fixtrs | 14 | 0.0 | 35 | 0.0 | 16 | 0.0 | 11 | 0.0 | 6 | 0.0 |
| 82. Furniture and parts thereof | 198 | 0.1 | 54 | 0.0 | 17 | 0.0 | 54 | 0.1 | 16 | 0.0 |
| 83. Travel goods,handbags and sim.containers | 2 | 0.0 | 1 | 0.0 | 2 | 0.0 | 2 | 0.0 | 5 | 0.0 |
| 84. Articles of apparel and clothing accessories | 13 | 0.0 | 7 | 0.0 | 33 | 0.0 | 25 | 0.0 | 24 | 0.0 |
| 85. Footwear | 16 | 0.0 | 36 | 0.0 | 24 | 0.0 | 27 | 0.0 | 42 | 0.0 |
| 87. Instruments and apparates n.e.s. | 10,716 | 6.0 | 7,453 | 5.1 | 5,033 | 4.4 | 3,278 | 3.1 | 3,644 | 2.7 |
| 88. Photographic equipment,optical goods etc. | 174 | 0.1 | 128 | 0.1 | 67 | 0.1 | 25 | 0.0 | 25 | 0.0 |
| 89. Miscellaneous manufactured articles,n.e.s. | 216 | 0.1 | 108 | 0.1 | 476 | 0.4 | 421 | 0.4 | 139 | 0.1 |
| 9. Goods not classified elsewhere | 36,572 | 20.4 | ||||||||
| 96. Coin (not gold coin or legal) | 36,572 | 20.4 | ||||||||
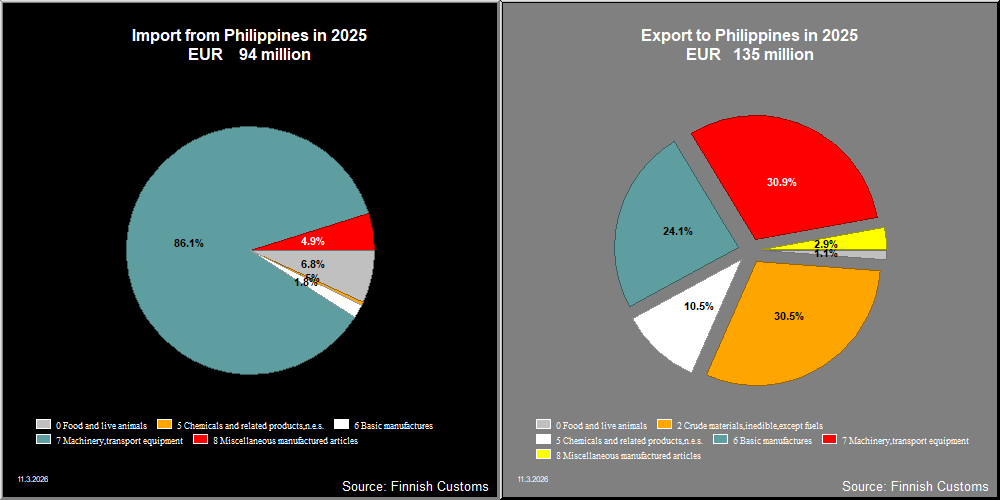
| All groups combined | 179,343 | 100.0 | 145,155 | 100.0 | 114,526 | 100.0 | 106,812 | 100.0 | 135,050 | 100.0 |
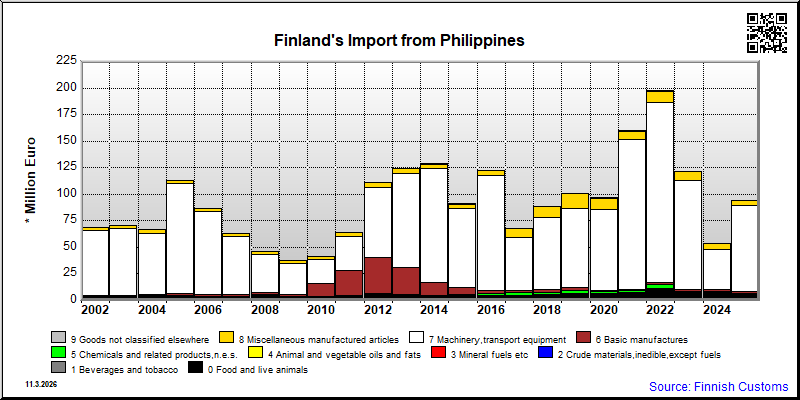
| 2021 | 2022 | 2023 | 2024 | 2025 | ||||||
|---|---|---|---|---|---|---|---|---|---|---|
| 1,000 € | % | 1,000 € | % | 1,000 € | % | 1,000 € | % | 1,000 € | % | |
| 0. Food and live animals | 6,947 | 4.3 | 10,514 | 5.3 | 7,083 | 5.8 | 7,625 | 14.2 | 6,381 | 6.8 |
| 01. Meat and meat preparations | 1 | 0.0 | 2 | 0.0 | 6 | 0.0 | 4 | 0.0 | 11 | 0.0 |
| 03. Fish and fish preparations | 1,770 | 1.1 | 4,966 | 2.5 | 2,889 | 2.4 | 3,254 | 6.0 | 1,549 | 1.6 |
| 04. Cereals and cereal preparations | 276 | 0.2 | 281 | 0.1 | 511 | 0.4 | 372 | 0.7 | 374 | 0.4 |
| 05. Vegetables and fruit | 4,756 | 3.0 | 5,120 | 2.6 | 3,501 | 2.9 | 3,782 | 7.0 | 4,008 | 4.3 |
| 06. Sugars,sugar preparations and honey | 8 | 0.0 | 5 | 0.0 | 3 | 0.0 | 8 | 0.0 | 8 | 0.0 |
| 07. Coffee,tea,cocoa,spices | 23 | 0.0 | 46 | 0.0 | 62 | 0.1 | 59 | 0.1 | 57 | 0.1 |
| 09. Miscellaneous edible products and preparations | 114 | 0.1 | 93 | 0.0 | 112 | 0.1 | 147 | 0.3 | 373 | 0.4 |
| 1. Beverages and tobacco | 1 | 0.0 | 6 | 0.0 | 4 | 0.0 | 29 | 0.1 | 8 | 0.0 |
| 11. Beverages | 1 | 0.0 | 6 | 0.0 | 4 | 0.0 | 29 | 0.1 | 8 | 0.0 |
| 2. Crude materials,inedible,except fuels | 7 | 0.0 | 43 | 0.0 | 32 | 0.0 | 27 | 0.1 | 9 | 0.0 |
| 24. Cork and wood | 2 | 0.0 | ||||||||
| 26. Textile fibres and their wastes | 1 | 0.0 | 6 | 0.0 | ||||||
| 27. Crude fertilizers and crude minerals | 1 | 0.0 | ||||||||
| 29. Crude animal,vegetable materials n.e.s. | 7 | 0.0 | 42 | 0.0 | 25 | 0.0 | 26 | 0.0 | 7 | 0.0 |
| 4. Animal and vegetable oils and fats | 375 | 0.2 | 283 | 0.1 | 94 | 0.1 | 30 | 0.1 | 151 | 0.2 |
| 42. Fixed vegetable fats and oils | 313 | 0.2 | 283 | 0.1 | 94 | 0.1 | 30 | 0.1 | 151 | 0.2 |
| 43. Processed animal or vegetable oils,etc. | 62 | 0.0 | ||||||||
| 5. Chemicals and related products,n.e.s. | 1,975 | 1.2 | 4,265 | 2.2 | 1,614 | 1.3 | 378 | 0.7 | 487 | 0.5 |
| 54. Medicinal and pharmaceutical products | 1 | 0.0 | 1 | 0.0 | 1 | 0.0 | 2 | 0.0 | ||
| 55. Perfume,cleaning etc.preparations | 20 | 0.0 | 18 | 0.0 | 83 | 0.1 | 121 | 0.2 | 239 | 0.3 |
| 56. Fertilizers,manufactured | 1 | 0.0 | 2 | 0.0 | ||||||
| 57. Plastics in primary forms | 27 | 0.0 | ||||||||
| 58. Plastics in non-primary forms | 39 | 0.0 | 51 | 0.0 | 56 | 0.0 | 112 | 0.2 | 128 | 0.1 |
| 59. Chemical materials and products,n.e.s. | 1,888 | 1.2 | 4,196 | 2.1 | 1,473 | 1.2 | 143 | 0.3 | 115 | 0.1 |
| 6. Basic manufactures | 1,083 | 0.7 | 1,607 | 0.8 | 1,900 | 1.6 | 2,574 | 4.8 | 1,648 | 1.8 |
| 61. Leather,dressed fur,etc. | 3 | 0.0 | ||||||||
| 62. Rubber manufactures,n.e.s. | 128 | 0.1 | 668 | 0.3 | 1,380 | 1.1 | 2,031 | 3.8 | 871 | 0.9 |
| 63. Wood and cork manufactures | 81 | 0.1 | 92 | 0.0 | 114 | 0.1 | 48 | 0.1 | 182 | 0.2 |
| 64. Paper,paperboard and articles thereof | 12 | 0.0 | 10 | 0.0 | 10 | 0.0 | 8 | 0.0 | 9 | 0.0 |
| 65. Textile yarn,fabrics,made up articles,etc. | 368 | 0.2 | 162 | 0.1 | 176 | 0.1 | 188 | 0.3 | 248 | 0.3 |
| 66. Non-metallic mineral manufactures,n.e.s. | 22 | 0.0 | 12 | 0.0 | 5 | 0.0 | 17 | 0.0 | 16 | 0.0 |
| 67. Iron and steel | 25 | 0.0 | 16 | 0.0 | 4 | 0.0 | 1 | 0.0 | 4 | 0.0 |
| 69. Manufactures of metals,n.e.s. | 447 | 0.3 | 648 | 0.3 | 211 | 0.2 | 281 | 0.5 | 314 | 0.3 |
| 7. Machinery,transport equipment | 140,738 | 88.1 | 169,958 | 86.0 | 102,417 | 84.2 | 36,907 | 68.6 | 80,838 | 85.9 |
| 71. Power generating machinery and equipment | 598 | 0.4 | 1,628 | 0.8 | 9,398 | 7.7 | 731 | 1.4 | 840 | 0.9 |
| 72. Machinery for specialized industries | 21 | 0.0 | 12 | 0.0 | 98 | 0.1 | 7 | 0.0 | 95 | 0.1 |
| 73. Metal working machinery | 394 | 0.2 | 442 | 0.2 | 319 | 0.3 | 66 | 0.1 | 2 | 0.0 |
| 74. General industrial machinery n.e.s. | 1,666 | 1.0 | 2,015 | 1.0 | 2,827 | 2.3 | 2,448 | 4.6 | 3,815 | 4.1 |
| 75. Office machines and adp machines | 51,617 | 32.3 | 27,233 | 13.8 | 8,957 | 7.4 | 7,497 | 13.9 | 7,646 | 8.1 |
| 76. Telecommunications and sound recording equipment | 11,387 | 7.1 | 2,998 | 1.5 | 2,421 | 2.0 | 2,373 | 4.4 | 7,636 | 8.1 |
| 77. Electric machinery,n.e.s.and parts | 75,006 | 46.9 | 135,417 | 68.5 | 78,161 | 64.2 | 23,697 | 44.0 | 60,656 | 64.4 |
| 78. Road vehicles | 49 | 0.0 | 86 | 0.0 | 66 | 0.1 | 32 | 0.1 | 52 | 0.1 |
| 79. Other transport equipment | 127 | 0.1 | 169 | 0.1 | 56 | 0.1 | 96 | 0.1 | ||
| 8. Miscellaneous manufactured articles | 7,893 | 4.9 | 10,382 | 5.3 | 8,527 | 7.0 | 6,164 | 11.5 | 4,569 | 4.9 |
| 81. Prefabr.buildings;sanitary,lighting etc.fixtrs | 80 | 0.1 | 31 | 0.0 | 11 | 0.0 | 17 | 0.0 | 16 | 0.0 |
| 82. Furniture and parts thereof | 34 | 0.0 | 1,006 | 0.5 | 231 | 0.2 | 367 | 0.7 | 190 | 0.2 |
| 83. Travel goods,handbags and sim.containers | 417 | 0.3 | 604 | 0.3 | 496 | 0.4 | 600 | 1.1 | 658 | 0.7 |
| 84. Articles of apparel and clothing accessories | 2,045 | 1.3 | 1,745 | 0.9 | 1,906 | 1.6 | 970 | 1.8 | 754 | 0.8 |
| 85. Footwear | 287 | 0.2 | 648 | 0.3 | 530 | 0.4 | 408 | 0.8 | 305 | 0.3 |
| 87. Instruments and apparates n.e.s. | 3,528 | 2.2 | 4,585 | 2.3 | 4,533 | 3.7 | 2,964 | 5.5 | 1,725 | 1.8 |
| 88. Photographic equipment,optical goods etc. | 38 | 0.0 | 253 | 0.1 | 52 | 0.0 | 77 | 0.1 | 206 | 0.2 |
| 89. Miscellaneous manufactured articles,n.e.s. | 1,464 | 0.9 | 1,510 | 0.8 | 767 | 0.6 | 762 | 1.4 | 715 | 0.8 |
| 9. Goods not classified elsewhere | 818 | 0.5 | 598 | 0.3 | 34 | 0.0 | 65 | 0.1 | 62 | 0.1 |
| 93. Special transactions and commodities not classified | 818 | 0.5 | 598 | 0.3 | 34 | 0.0 | 65 | 0.1 | 62 | 0.1 |
| All groups combined | 159,837 | 100.0 | 197,656 | 100.0 | 121,705 | 100.0 | 53,799 | 100.0 | 94,153 | 100.0 |
| Classification | Description | Year level | Quarter level | Month level | |
|---|---|---|---|---|---|
| SITC | Standard International Trade Classification (classification system is maintained by the United Nations) | ███ | ███ | ███ | |
| BEC | The standard of statistical classification of BEC (Broad Economic Categories) is upheld by the UN and it is based on SITC-nomenclature. | ███ | ███ | ███ | |
| NACE | National industrial classification based on Statistical Classification of Economic Activities in the European Community Nomenclature générale des Activités économiques dans les Communautés européennes | ███ | ███ | ███ | |
| CPA | CPA = Classification of Products by Activities | ███ | ███ | ███ | |
| CN | The Combined Nomenclature is the common nomenclature of the European Community. | ███ | ███ | ███ |