
| Export of goods from Finland and import to Finland | Trade Balance |
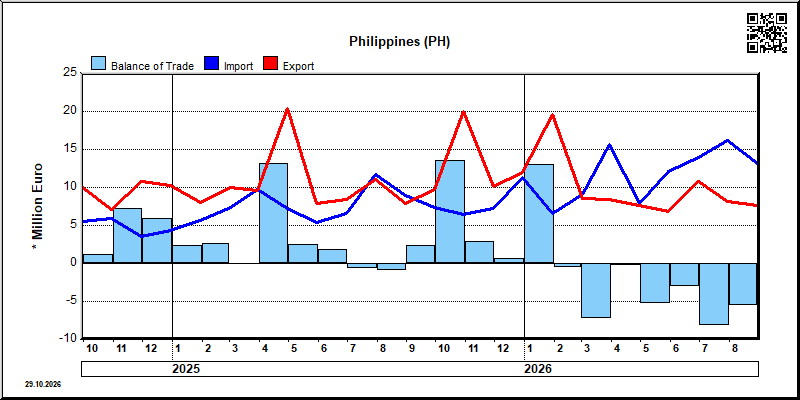
| Year | Month | Import 1,000 € | Export 1,000 € | Trade 1,000 € | Trade Balance 1,000 € |
|---|---|---|---|---|---|
| 2023 | 1 | 11,820 | 7,696 | 19,517 | -4,124 |
| 2023 | 2 | 6,616 | 4,364 | 10,980 | -2,253 |
| 2023 | 3 | 12,429 | 11,163 | 23,592 | -1,265 |
| 2023 | 4 | 25,386 | 8,758 | 34,144 | -16,628 |
| 2023 | 5 | 9,241 | 11,421 | 20,662 | 2,181 |
| 2023 | 6 | 10,104 | 10,252 | 20,357 | 148 |
| 2023 | 7 | 12,665 | 8,684 | 21,349 | -3,980 |
| 2023 | 8 | 8,063 | 22,061 | 30,124 | 13,998 |
| 2023 | 9 | 7,767 | 8,598 | 16,365 | 832 |
| 2023 | 10 | 4,403 | 7,146 | 11,549 | 2,742 |
| 2023 | 11 | 3,694 | 7,859 | 11,553 | 4,165 |
| 2023 | 12 | 9,574 | 6,438 | 16,012 | -3,136 |
| 2024 | 1 | 2,949 | 9,454 | 12,404 | 6,505 |
| 2024 | 2 | 4,539 | 10,105 | 14,643 | 5,566 |
| 2024 | 3 | 3,541 | 4,921 | 8,462 | 1,380 |
| 2024 | 4 | 5,330 | 8,137 | 13,467 | 2,807 |
| 2024 | 5 | 4,129 | 9,676 | 13,805 | 5,547 |
| 2024 | 6 | 4,015 | 7,343 | 11,358 | 3,329 |
| 2024 | 7 | 4,753 | 7,896 | 12,649 | 3,143 |
| 2024 | 8 | 5,073 | 11,340 | 16,413 | 6,267 |
| 2024 | 9 | 5,565 | 10,058 | 15,623 | 4,492 |
| 2024 | 10 | 5,923 | 7,065 | 12,989 | 1,142 |
| 2024 | 11 | 3,588 | 10,811 | 14,399 | 7,223 |
| 2024 | 12 | 4,302 | 10,213 | 14,515 | 5,910 |
| 2025 | 1 | 5,619 | 8,046 | 13,666 | 2,427 |
| 2025 | 2 | 7,311 | 9,934 | 17,245 | 2,624 |
| 2025 | 3 | 9,761 | 9,583 | 19,344 | -177 |
| 2025 | 4 | 7,218 | 20,336 | 27,554 | 13,118 |
| 2025 | 5 | 5,335 | 7,860 | 13,195 | 2,525 |
| 2025 | 6 | 6,579 | 8,472 | 15,051 | 1,894 |
| 2025 | 7 | 11,659 | 10,989 | 22,648 | -670 |
| 2025 | 8 | 8,911 | 7,957 | 16,868 | -954 |
| 2025 | 9 | 7,336 | 9,717 | 17,054 | 2,381 |
| 2025 | 10 | 6,494 | 20,033 | 26,527 | 13,539 |
| 2025 | 11 | 7,204 | 10,101 | 17,305 | 2,896 |
| 2025 | 12 | 11,254 | 11,931 | 23,184 | 677 |
| 2026 | 1 | 6,537 | 19,580 | 26,117 | 13,042 |
| 2026 | 2 | 9,067 | 8,541 | 17,608 | -527 |
| 2026 | 3 | 15,633 | 8,366 | 23,999 | -7,266 |
| 2026 | 4 | 7,884 | 7,662 | 15,547 | -222 |
| 2026 | 5 | 12,160 | 6,848 | 19,007 | -5,312 |
| 2026 | 6 | 13,926 | 10,839 | 24,765 | -3,087 |
| 2026 | 7 | 16,196 | 8,104 | 24,300 | -8,093 |
| 2026 | 8 | 13,106 | 7,643 | 20,749 | -5,463 |
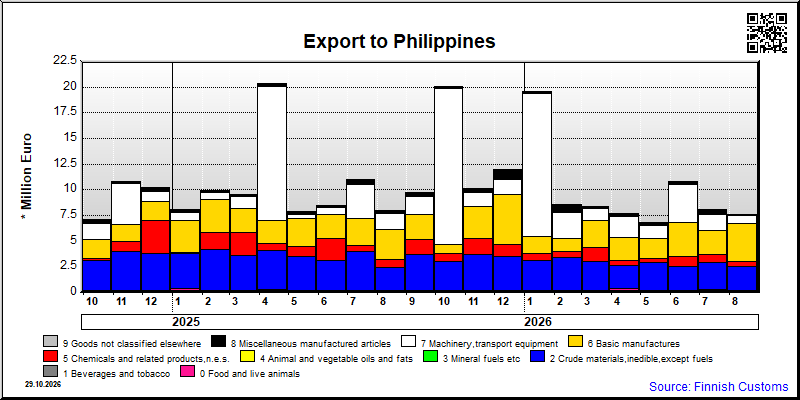
| 2026/4 | 2026/5 | 2026/6 | 2026/7 | 2026/8 | ||||||
|---|---|---|---|---|---|---|---|---|---|---|
| 1000 € | % | 1000 € | % | 1000 € | % | 1000 € | % | 1000 € | % | |
| 0. Food and live animals | 352 | 4.6 | 25 | 0.4 | 278 | 3.4 | 26 | 0.3 | ||
| 2. Crude materials,inedible,except fuels | 2,247 | 29.3 | 2,945 | 43.0 | 2,484 | 22.9 | 2,651 | 32.7 | 2,496 | 32.7 |
| 5. Chemicals and related products,n.e.s. | 508 | 6.6 | 373 | 5.5 | 1,011 | 9.3 | 777 | 9.6 | 531 | 6.9 |
| 6. Basic manufactures | 2,294 | 29.9 | 1,879 | 27.4 | 3,279 | 30.3 | 2,339 | 28.9 | 3,663 | 47.9 |
| 7. Machinery,transport equipment | 1,994 | 26.0 | 1,279 | 18.7 | 3,773 | 34.8 | 1,591 | 19.6 | 827 | 10.8 |
| 8. Miscellaneous manufactured articles | 267 | 3.5 | 346 | 5.1 | 291 | 2.7 | 467 | 5.8 | 100 | 1.3 |
| All groups combined | 7,662 | 100.0 | 6,848 | 100.0 | 10,839 | 100.0 | 8,104 | 100.0 | 7,643 | 100.0 |

| 2026/4 | 2026/5 | 2026/6 | 2026/7 | 2026/8 | ||||||
|---|---|---|---|---|---|---|---|---|---|---|
| 1000 € | % | 1000 € | % | 1000 € | % | 1000 € | % | 1000 € | % | |
| 0. Food and live animals | 966 | 12.3 | 554 | 4.6 | 888 | 6.4 | 1,054 | 6.5 | 945 | 7.2 |
| 1. Beverages and tobacco | 2 | 0.0 | 2 | 0.0 | 4 | 0.0 | 2 | 0.0 | 2 | 0.0 |
| 2. Crude materials,inedible,except fuels | 1 | 0.0 | 1 | 0.0 | 2 | 0.0 | 2 | 0.0 | 81 | 0.6 |
| 4. Animal and vegetable oils and fats | 4 | 0.0 | 4 | 0.0 | 115 | 0.9 | ||||
| 5. Chemicals and related products,n.e.s. | 30 | 0.4 | 273 | 2.2 | 101 | 0.7 | 31 | 0.2 | 130 | 1.0 |
| 6. Basic manufactures | 153 | 1.9 | 220 | 1.8 | 159 | 1.1 | 515 | 3.2 | 409 | 3.1 |
| 7. Machinery,transport equipment | 5,968 | 75.7 | 10,118 | 83.2 | 11,683 | 83.9 | 13,906 | 85.9 | 10,909 | 83.2 |
| 8. Miscellaneous manufactured articles | 758 | 9.6 | 985 | 8.1 | 1,084 | 7.8 | 676 | 4.2 | 512 | 3.9 |
| 9. Goods not classified elsewhere | 6 | 0.1 | 5 | 0.0 | 5 | 0.0 | 5 | 0.0 | 4 | 0.0 |
| All groups combined | 7,884 | 100.0 | 12,160 | 100.0 | 13,926 | 100.0 | 16,196 | 100.0 | 13,106 | 100.0 |
| Classification | Description | Year level | Quarter level | Month level | Year 2026 sofar |
|---|---|---|---|---|---|
| SITC | Standard International Trade Classification (classification system is maintained by the United Nations) | ███ | ███ | ███ | ███ |
| BEC | The standard of statistical classification of BEC (Broad Economic Categories) is upheld by the UN and it is based on SITC-nomenclature. | ███ | ███ | ███ | ███ |
| NACE | National industrial classification based on Statistical Classification of Economic Activities in the European Community Nomenclature générale des Activités économiques dans les Communautés européennes | ███ | ███ | ███ | ███ |
| CPA | CPA = Classification of Products by Activities | ███ | ███ | ███ | ███ |
| CN | The Combined Nomenclature is the common nomenclature of the European Community. | ███ | ███ | ███ | ███ |