
| Export of goods from Finland and import to Finland | BEC (Broad Economic Categories) |
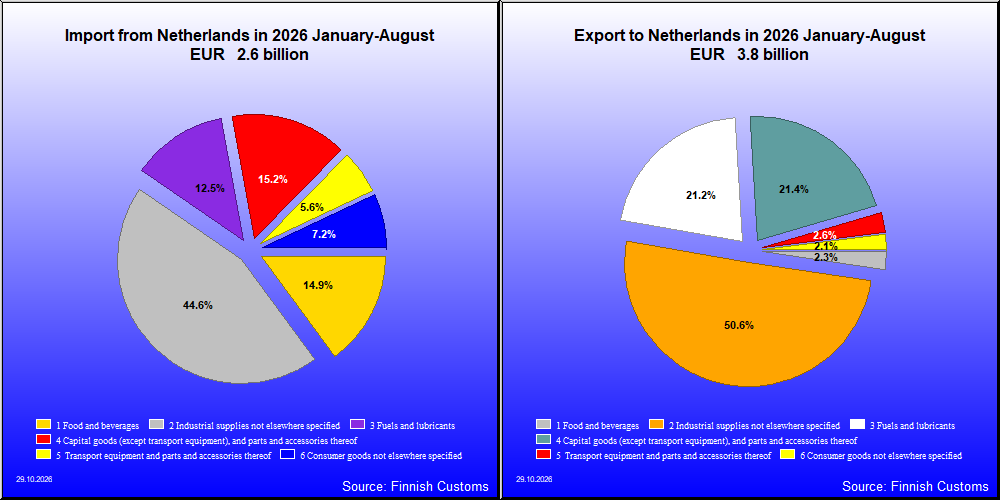
| 2026 1-8 1,000 € | 2025 1-8 1,000 € | Change % |
|
|---|---|---|---|
| 1. Food and beverages | 86,345 | 85,529 | 1.0 |
| 11. Food and beverages, primary | 28,268 | 25,356 | 11.5 |
| 111. Food and beverages, primary, mainly for industry | 1,936 | 19 | .. |
| 112. Food and beverages, primary, mainly for household consumption | 26,331 | 25,337 | 3.9 |
| 12. Food and beverages, processed | 58,077 | 60,173 | -3.5 |
| 121. Food and beverages, processed, mainly for industry | 17,343 | 20,319 | -14.6 |
| 122. Food and beverages, processed, mainly for household consumption | 40,734 | 39,854 | 2.2 |
| 2. Industrial supplies not elsewhere specified | 1,914,652 | 2,407,090 | -20.5 |
| 21. Industrial supplies not elsewhere specified, primary | 32,269 | 39,308 | -17.9 |
| 22. Industrial supplies not elsewhere specified, processed | 1,882,384 | 2,367,782 | -20.5 |
| 3. Fuels and lubricants | 802,159 | 608,998 | 31.7 |
| 31. Fuels and lubricants, primary | 10,891 | 11,272 | -3.4 |
| 32. Fuels and lubricants, processed | 791,268 | 597,726 | 32.4 |
| 321. Fuels and lubricants, motor spirit | 433,846 | 365,032 | 18.9 |
| 322. Fuels and lubricants, other | 357,422 | 232,694 | 53.6 |
| 4. Capital goods (except transport equipment), and parts and accessories thereof | 808,450 | 661,677 | 22.2 |
| 41. Capital goods (except transport equipment) | 427,350 | 339,532 | 25.9 |
| 42. Capital goods (except transport equipment), parts and accessories | 381,101 | 322,145 | 18.3 |
| 5. Transport equipment and parts and accessories thereof | 96,864 | 94,432 | 2.6 |
| 51. Passenger motor vehicles | 3,995 | 700 | 470.7 |
| 52. Transport equipment, other than passenger motor vehicles | 18,226 | 19,044 | -4.3 |
| 521. Transport equipment, other than passenger motor vehicles, industrial | 16,842 | 16,493 | 2.1 |
| 522. Transport equipment, other than passenger motor vehicles, non-industrial | 1,384 | 2,551 | -45.7 |
| 53. Transport equipment, parts and accessories | 74,642 | 74,687 | -0.1 |
| 6. Consumer goods not elsewhere specified | 77,702 | 77,422 | 0.4 |
| 61. Consumer goods not elsewhere specified, durable | 8,534 | 8,678 | -1.7 |
| 62. Consumer goods not elsewhere specified, semi-durable | 21,738 | 22,096 | -1.6 |
| 63. Consumer goods not elsewhere specified, non-durable | 47,430 | 46,648 | 1.7 |
| 7. Goods not elsewhere specified | 4,665 | 5,259 | -11.3 |
| All groups | 3,790,837 | 3,940,407 | -3.8 |
| 2026 1-8 1,000 € | 2025 1-8 1,000 € | Change % |
|
|---|---|---|---|
| 1. Food and beverages | 393,130 | 425,169 | -7.5 |
| 11. Food and beverages, primary | 120,741 | 105,712 | 14.2 |
| 111. Food and beverages, primary, mainly for industry | 9,385 | 4,380 | 114.3 |
| 112. Food and beverages, primary, mainly for household consumption | 111,356 | 101,332 | 9.9 |
| 12. Food and beverages, processed | 272,389 | 319,456 | -14.7 |
| 121. Food and beverages, processed, mainly for industry | 37,448 | 71,114 | -47.3 |
| 122. Food and beverages, processed, mainly for household consumption | 234,941 | 248,343 | -5.4 |
| 2. Industrial supplies not elsewhere specified | 1,175,664 | 1,155,450 | 1.7 |
| 21. Industrial supplies not elsewhere specified, primary | 456,755 | 419,616 | 8.9 |
| 22. Industrial supplies not elsewhere specified, processed | 718,909 | 735,834 | -2.3 |
| 3. Fuels and lubricants | 328,562 | 172,362 | 90.6 |
| 31. Fuels and lubricants, primary | 532 | 60 | 780.2 |
| 32. Fuels and lubricants, processed | 328,030 | 172,302 | 90.4 |
| 321. Fuels and lubricants, motor spirit | 0 | 37 | .. |
| 322. Fuels and lubricants, other | 328,030 | 172,265 | 90.4 |
| 4. Capital goods (except transport equipment), and parts and accessories thereof | 399,590 | 445,597 | -10.3 |
| 41. Capital goods (except transport equipment) | 234,086 | 342,472 | -31.6 |
| 42. Capital goods (except transport equipment), parts and accessories | 165,505 | 103,125 | 60.5 |
| 5. Transport equipment and parts and accessories thereof | 148,412 | 148,546 | -0.1 |
| 51. Passenger motor vehicles | 7,287 | 9,442 | -22.8 |
| 52. Transport equipment, other than passenger motor vehicles | 77,888 | 76,533 | 1.8 |
| 521. Transport equipment, other than passenger motor vehicles, industrial | 67,800 | 60,572 | 11.9 |
| 522. Transport equipment, other than passenger motor vehicles, non-industrial | 10,087 | 15,961 | -36.8 |
| 53. Transport equipment, parts and accessories | 63,237 | 62,571 | 1.1 |
| 6. Consumer goods not elsewhere specified | 188,409 | 303,101 | -37.8 |
| 61. Consumer goods not elsewhere specified, durable | 29,543 | 46,965 | -37.1 |
| 62. Consumer goods not elsewhere specified, semi-durable | 28,661 | 46,679 | -38.6 |
| 63. Consumer goods not elsewhere specified, non-durable | 130,205 | 209,456 | -37.8 |
| 7. Goods not elsewhere specified | 687 | 41,249 | -98.3 |
| All groups | 2,634,454 | 2,691,473 | -2.1 |
| Classification | Description | Year level | Quarter level | Month level | Year 2026 sofar |
|---|---|---|---|---|---|
| SITC | Standard International Trade Classification (classification system is maintained by the United Nations) | ███ | ███ | ███ | ███ |
| BEC | The standard of statistical classification of BEC (Broad Economic Categories) is upheld by the UN and it is based on SITC-nomenclature. | ███ | ███ | ███ | ███ |
| NACE | National industrial classification based on Statistical Classification of Economic Activities in the European Community Nomenclature générale des Activités économiques dans les Communautés européennes | ███ | ███ | ███ | ███ |
| CPA | CPA = Classification of Products by Activities | ███ | ███ | ███ | ███ |
| CN | The Combined Nomenclature is the common nomenclature of the European Community. | ███ | ███ | ███ | ███ |