
| Export of goods from Finland and import to Finland | Trade Balance |

| Year | Import 1,000 € | Export 1,000 € | Trade 1,000 € | Trade balance 1,000 € |
|---|---|---|---|---|
| 2002 | 27,753 | 45,290 | 73,043 | 17,537 |
| 2003 | 11,226 | 3,699 | 14,925 | -7,527 |
| 2004 | 16,238 | 3,105 | 19,343 | -13,133 |
| 2005 | 5,199 | 6,611 | 11,810 | 1,412 |
| 2006 | 44,995 | 14,410 | 59,405 | -30,585 |
| 2007 | 69,795 | 5,792 | 75,587 | -64,003 |
| 2008 | 29,706 | 5,428 | 35,134 | -24,278 |
| 2009 | 17,412 | 25,203 | 42,615 | 7,790 |
| 2010 | 16,206 | 22,118 | 38,324 | 5,912 |
| 2011 | 5,249 | 19,463 | 24,712 | 14,214 |
| 2012 | 3,325 | 3,410 | 6,735 | 84 |
| 2013 | 2,153 | 4,228 | 6,381 | 2,075 |
| 2014 | 2,684 | 30,945 | 33,630 | 28,261 |
| 2015 | 2,110 | 22,604 | 24,713 | 20,494 |
| 2016 | 5,326 | 45,894 | 51,219 | 40,568 |
| 2017 | 6,334 | 81,088 | 87,422 | 74,754 |
| 2018 | 12,839 | 12,185 | 25,025 | -654 |
| 2019 | 12,603 | 17,216 | 29,819 | 4,613 |
| 2020 | 6,723 | 10,065 | 16,788 | 3,343 |
| 2021 | 9,965 | 28,749 | 38,713 | 18,784 |
| 2022 | 8,365 | 11,029 | 19,394 | 2,664 |
| 2023 | 9,115 | 11,760 | 20,874 | 2,645 |
| 2024 | 14,792 | 95,001 | 109,793 | 80,209 |
| 2025 | 19,737 | 15,349 | 35,086 | -4,389 |
*) SITC = Standard International Trade Classification (classification system is maintained by the United Nations)
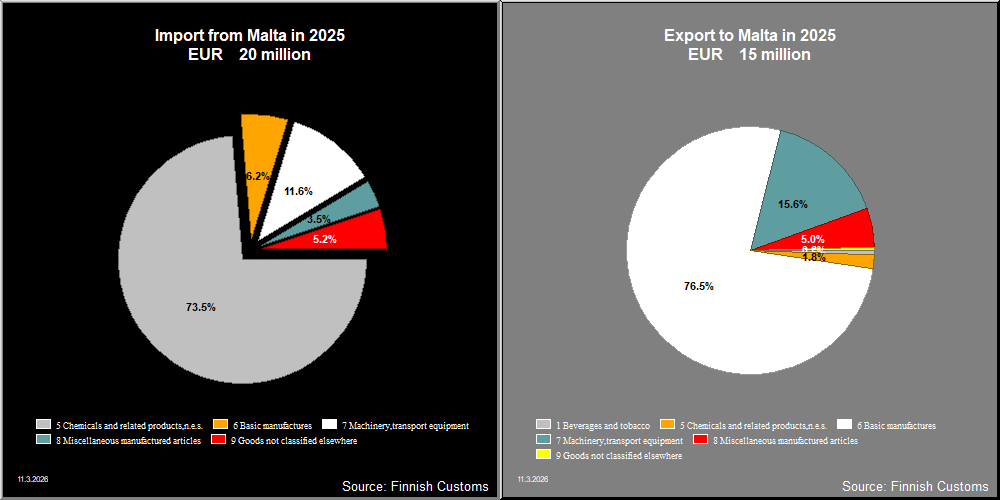

| 2021 | 2022 | 2023 | 2024 | 2025 | ||||||
|---|---|---|---|---|---|---|---|---|---|---|
| 1,000 € | % | 1,000 € | % | 1,000 € | % | 1,000 € | % | 1,000 € | % | |
| 0. Food and live animals | 221 | 0.8 | 482 | 4.4 | 10 | 0.1 | 28 | 0.0 | 1 | 0.0 |
| 02. Dairy products and birds' eggs | 196 | 0.7 | 406 | 3.7 | ||||||
| 04. Cereals and cereal preparations | 13 | 0.0 | 7 | 0.1 | 2 | 0.0 | 6 | 0.0 | ||
| 05. Vegetables and fruit | 1 | 0.0 | 1 | 0.0 | ||||||
| 06. Sugars,sugar preparations and honey | 10 | 0.0 | 16 | 0.1 | 10 | 0.0 | ||||
| 07. Coffee,tea,cocoa,spices | 1 | 0.0 | 4 | 0.0 | 1 | 0.0 | ||||
| 08. Feeding stuff for animals | 48 | 0.4 | 9 | 0.1 | 10 | 0.0 | 1 | 0.0 | ||
| 09. Miscellaneous edible products and preparations | 1 | 0.0 | ||||||||
| 1. Beverages and tobacco | 9 | 0.0 | 1 | 0.0 | 2 | 0.0 | 84 | 0.5 | ||
| 11. Beverages | 9 | 0.0 | 1 | 0.0 | 2 | 0.0 | 84 | 0.5 | ||
| 2. Crude materials,inedible,except fuels | 7 | 0.0 | 8 | 0.1 | 1 | 0.0 | 35 | 0.2 | ||
| 27. Crude fertilizers and crude minerals | 7 | 0.0 | 8 | 0.1 | 1 | 0.0 | 33 | 0.2 | ||
| 29. Crude animal,vegetable materials n.e.s. | 3 | 0.0 | ||||||||
| 3. Mineral fuels etc | 1 | 0.0 | ||||||||
| 33. Petroleum and products | 1 | 0.0 | ||||||||
| 5. Chemicals and related products,n.e.s. | 350 | 1.2 | 685 | 6.2 | 529 | 4.5 | 317 | 0.3 | 272 | 1.8 |
| 51. Organic chemicals | 105 | 0.9 | 1 | 0.0 | ||||||
| 52. Inorganic chemicals | 4 | 0.0 | 7 | 0.1 | 11 | 0.0 | ||||
| 54. Medicinal and pharmaceutical products | 96 | 0.3 | 221 | 2.0 | 231 | 2.0 | 113 | 0.1 | 129 | 0.8 |
| 55. Perfume,cleaning etc.preparations | 9 | 0.0 | 8 | 0.1 | 8 | 0.1 | 21 | 0.0 | 11 | 0.1 |
| 57. Plastics in primary forms | 56 | 0.2 | 60 | 0.5 | 2 | 0.0 | 74 | 0.1 | 66 | 0.4 |
| 58. Plastics in non-primary forms | 175 | 0.6 | 317 | 2.9 | 105 | 0.9 | 37 | 0.0 | 15 | 0.1 |
| 59. Chemical materials and products,n.e.s. | 10 | 0.0 | 71 | 0.6 | 77 | 0.7 | 60 | 0.1 | 51 | 0.3 |
| 6. Basic manufactures | 3,737 | 13.0 | 7,326 | 66.4 | 5,955 | 50.6 | 7,453 | 7.8 | 11,720 | 76.3 |
| 61. Leather,dressed fur,etc. | 16 | 0.1 | 32 | 0.3 | 35 | 0.3 | 43 | 0.0 | 51 | 0.3 |
| 62. Rubber manufactures,n.e.s. | 3 | 0.0 | 3 | 0.0 | 3 | 0.0 | 4 | 0.0 | 7 | 0.0 |
| 63. Wood and cork manufactures | 9 | 0.0 | 36 | 0.3 | 45 | 0.4 | 4 | 0.0 | 1 | 0.0 |
| 64. Paper,paperboard and articles thereof | 432 | 1.5 | 896 | 8.1 | 675 | 5.7 | 688 | 0.7 | 749 | 4.9 |
| 65. Textile yarn,fabrics,made up articles,etc. | 17 | 0.1 | 29 | 0.3 | 57 | 0.5 | 49 | 0.1 | 59 | 0.4 |
| 66. Non-metallic mineral manufactures,n.e.s. | 28 | 0.1 | 16 | 0.1 | 20 | 0.2 | 13 | 0.0 | 19 | 0.1 |
| 67. Iron and steel | 13 | 0.1 | ||||||||
| 68. Non-ferrous metals | 3,165 | 11.0 | 6,161 | 55.8 | 4,999 | 42.5 | 6,326 | 6.7 | 10,701 | 69.7 |
| 69. Manufactures of metals,n.e.s. | 66 | 0.2 | 140 | 1.3 | 122 | 1.0 | 326 | 0.3 | 134 | 0.9 |
| 7. Machinery,transport equipment | 23,349 | 80.9 | 1,755 | 15.9 | 4,418 | 37.5 | 86,159 | 90.7 | 2,391 | 15.6 |
| 71. Power generating machinery and equipment | 40 | 0.1 | 36 | 0.3 | 72 | 0.6 | 207 | 0.2 | 271 | 1.8 |
| 72. Machinery for specialized industries | 119 | 0.4 | 380 | 3.4 | 466 | 4.0 | 778 | 0.8 | 912 | 5.9 |
| 74. General industrial machinery n.e.s. | 111 | 0.4 | 71 | 0.6 | 124 | 1.1 | 217 | 0.2 | 138 | 0.9 |
| 75. Office machines and adp machines | 215 | 0.7 | 122 | 1.1 | 226 | 1.9 | 62 | 0.1 | 53 | 0.3 |
| 76. Telecommunications and sound recording equipment | 30 | 0.1 | 26 | 0.2 | 34 | 0.3 | 95 | 0.1 | 48 | 0.3 |
| 77. Electric machinery,n.e.s.and parts | 269 | 0.9 | 1,070 | 9.7 | 709 | 6.0 | 436 | 0.5 | 625 | 4.1 |
| 78. Road vehicles | 99 | 0.3 | 50 | 0.5 | 49 | 0.4 | 43 | 0.0 | 118 | 0.8 |
| 79. Other transport equipment | 22,467 | 77.9 | 2,738 | 23.3 | 84,321 | 88.8 | 228 | 1.5 | ||
| 8. Miscellaneous manufactured articles | 743 | 2.6 | 571 | 5.2 | 783 | 6.6 | 896 | 0.9 | 765 | 5.0 |
| 81. Prefabr.buildings;sanitary,lighting etc.fixtrs | 14 | 0.0 | 6 | 0.1 | 7 | 0.1 | 12 | 0.0 | 23 | 0.1 |
| 82. Furniture and parts thereof | 28 | 0.1 | 73 | 0.7 | 30 | 0.3 | 67 | 0.1 | 229 | 1.5 |
| 83. Travel goods,handbags and sim.containers | 1 | 0.0 | 1 | 0.0 | 3 | 0.0 | 1 | 0.0 | 1 | 0.0 |
| 84. Articles of apparel and clothing accessories | 14 | 0.0 | 7 | 0.1 | 4 | 0.0 | 8 | 0.0 | 8 | 0.1 |
| 85. Footwear | 2 | 0.0 | ||||||||
| 87. Instruments and apparates n.e.s. | 652 | 2.3 | 286 | 2.6 | 483 | 4.1 | 604 | 0.6 | 298 | 1.9 |
| 88. Photographic equipment,optical goods etc. | 4 | 0.0 | 1 | 0.0 | 3 | 0.0 | 3 | 0.0 | 8 | 0.1 |
| 89. Miscellaneous manufactured articles,n.e.s. | 30 | 0.1 | 197 | 1.8 | 253 | 2.1 | 201 | 0.2 | 196 | 1.3 |
| 9. Goods not classified elsewhere | 439 | 1.5 | 210 | 1.9 | 78 | 0.7 | 137 | 0.1 | 86 | 0.6 |
| 93. Special transactions and commodities not classified | 439 | 1.5 | 210 | 1.9 | 78 | 0.7 | 137 | 0.1 | 86 | 0.6 |
| All groups combined | 28,855 | 100.0 | 11,039 | 100.0 | 11,774 | 100.0 | 94,993 | 100.0 | 15,354 | 100.0 |

| 2021 | 2022 | 2023 | 2024 | 2025 | ||||||
|---|---|---|---|---|---|---|---|---|---|---|
| 1,000 € | % | 1,000 € | % | 1,000 € | % | 1,000 € | % | 1,000 € | % | |
| 0. Food and live animals | 2 | 0.0 | ||||||||
| 04. Cereals and cereal preparations | 2 | 0.0 | ||||||||
| 2. Crude materials,inedible,except fuels | 149 | 1.7 | 2 | 0.0 | ||||||
| 28. Metalliferous ores and metal scrap | 149 | 1.7 | 2 | 0.0 | ||||||
| 5. Chemicals and related products,n.e.s. | 3,181 | 32.0 | 3,009 | 34.3 | 3,817 | 41.9 | 8,846 | 60.5 | 14,517 | 73.5 |
| 51. Organic chemicals | 1 | 0.0 | 4 | 0.0 | 1 | 0.0 | 4 | 0.0 | ||
| 52. Inorganic chemicals | 1 | 0.0 | 1 | 0.0 | 2 | 0.0 | 1 | 0.0 | 2 | 0.0 |
| 54. Medicinal and pharmaceutical products | 3,038 | 30.6 | 2,874 | 32.8 | 3,499 | 38.4 | 8,518 | 58.2 | 14,389 | 72.9 |
| 55. Perfume,cleaning etc.preparations | 7 | 0.1 | ||||||||
| 58. Plastics in non-primary forms | 142 | 1.4 | 133 | 1.5 | 24 | 0.3 | 1 | 0.0 | 1 | 0.0 |
| 59. Chemical materials and products,n.e.s. | 280 | 3.1 | 325 | 2.2 | 120 | 0.6 | ||||
| 6. Basic manufactures | 2,633 | 26.5 | 1,926 | 22.0 | 2,058 | 22.6 | 1,901 | 13.0 | 1,215 | 6.2 |
| 62. Rubber manufactures,n.e.s. | 163 | 1.6 | 170 | 1.9 | 122 | 1.3 | 131 | 0.9 | 94 | 0.5 |
| 64. Paper,paperboard and articles thereof | 16 | 0.2 | 26 | 0.3 | 3 | 0.0 | 5 | 0.0 | ||
| 65. Textile yarn,fabrics,made up articles,etc. | 2,187 | 22.0 | 1,687 | 19.2 | 1,819 | 20.0 | 1,737 | 11.9 | 1,079 | 5.5 |
| 66. Non-metallic mineral manufactures,n.e.s. | 37 | 0.4 | 1 | 0.0 | ||||||
| 67. Iron and steel | 30 | 0.3 | 25 | 0.3 | 9 | 0.1 | ||||
| 68. Non-ferrous metals | 214 | 2.2 | 1 | 0.0 | 1 | 0.0 | ||||
| 69. Manufactures of metals,n.e.s. | 40 | 0.4 | 27 | 0.3 | 44 | 0.5 | 30 | 0.2 | 36 | 0.2 |
| 7. Machinery,transport equipment | 2,870 | 28.9 | 2,541 | 29.0 | 2,761 | 30.3 | 2,409 | 16.5 | 2,289 | 11.6 |
| 72. Machinery for specialized industries | 382 | 3.8 | 493 | 5.6 | 523 | 5.7 | 601 | 4.1 | 398 | 2.0 |
| 73. Metal working machinery | 192 | 1.9 | 52 | 0.6 | 2 | 0.0 | ||||
| 74. General industrial machinery n.e.s. | 222 | 2.2 | 319 | 3.6 | 599 | 6.6 | 649 | 4.4 | 408 | 2.1 |
| 75. Office machines and adp machines | 1 | 0.0 | ||||||||
| 76. Telecommunications and sound recording equipment | 927 | 9.3 | 1,012 | 11.6 | 1,020 | 11.2 | 768 | 5.2 | 1,001 | 5.1 |
| 77. Electric machinery,n.e.s.and parts | 1,099 | 11.1 | 641 | 7.3 | 607 | 6.7 | 373 | 2.5 | 460 | 2.3 |
| 78. Road vehicles | 47 | 0.5 | 24 | 0.3 | 10 | 0.1 | 18 | 0.1 | 18 | 0.1 |
| 79. Other transport equipment | 4 | 0.0 | ||||||||
| 8. Miscellaneous manufactured articles | 771 | 7.8 | 707 | 8.1 | 461 | 5.1 | 656 | 4.5 | 682 | 3.5 |
| 84. Articles of apparel and clothing accessories | 1 | 0.0 | 3 | 0.0 | 1 | 0.0 | ||||
| 87. Instruments and apparates n.e.s. | 267 | 2.7 | 290 | 3.3 | 333 | 3.7 | 157 | 1.1 | 205 | 1.0 |
| 89. Miscellaneous manufactured articles,n.e.s. | 502 | 5.1 | 414 | 4.7 | 127 | 1.4 | 499 | 3.4 | 477 | 2.4 |
| 9. Goods not classified elsewhere | 487 | 4.9 | 431 | 4.9 | 1 | 0.0 | 819 | 5.6 | 1,036 | 5.2 |
| 93. Special transactions and commodities not classified | 487 | 4.9 | 431 | 4.9 | 1 | 0.0 | 819 | 5.6 | 1,036 | 5.2 |
| All groups combined | 9,941 | 100.0 | 8,763 | 100.0 | 9,101 | 100.0 | 14,631 | 100.0 | 19,739 | 100.0 |
| Classification | Description | Year level | Quarter level | Month level | |
|---|---|---|---|---|---|
| SITC | Standard International Trade Classification (classification system is maintained by the United Nations) | ███ | ███ | ███ | |
| BEC | The standard of statistical classification of BEC (Broad Economic Categories) is upheld by the UN and it is based on SITC-nomenclature. | ███ | ███ | ███ | |
| NACE | National industrial classification based on Statistical Classification of Economic Activities in the European Community Nomenclature générale des Activités économiques dans les Communautés européennes | ███ | ███ | ███ | |
| CPA | CPA = Classification of Products by Activities | ███ | ███ | ███ | |
| CN | The Combined Nomenclature is the common nomenclature of the European Community. | ███ | ███ | ███ |