
| Export of goods from Finland and import to Finland | Trade Balance |

| Year | Import 1,000 € | Export 1,000 € | Trade 1,000 € | Trade balance 1,000 € |
|---|---|---|---|---|
| 2002 | 5 | 6,608 | 6,613 | 6,603 |
| 2003 | 0 | 21,712 | 21,712 | 21,712 |
| 2004 | 0 | 18,509 | 18,509 | 18,509 |
| 2005 | 134 | 137,686 | 137,820 | 137,552 |
| 2006 | 91 | 92,862 | 92,953 | 92,771 |
| 2007 | 19 | 112,549 | 112,567 | 112,530 |
| 2008 | 3 | 184,610 | 184,613 | 184,607 |
| 2009 | 3 | 32,952 | 32,955 | 32,948 |
| 2010 | 0 | 17,457 | 17,457 | 17,456 |
| 2011 | 1 | 32,823 | 32,824 | 32,821 |
| 2012 | 11 | 20,960 | 20,971 | 20,949 |
| 2013 | 6 | 50,165 | 50,171 | 50,159 |
| 2014 | 8 | 21,493 | 21,501 | 21,486 |
| 2015 | 26 | 12,665 | 12,692 | 12,639 |
| 2016 | 32 | 3,909 | 3,941 | 3,877 |
| 2017 | 24 | 9,090 | 9,114 | 9,066 |
| 2018 | 74 | 10,184 | 10,258 | 10,109 |
| 2019 | 18 | 39,054 | 39,072 | 39,036 |
| 2020 | 93 | 13,968 | 14,061 | 13,875 |
| 2021 | 25 | 6,000 | 6,025 | 5,975 |
| 2022 | 26 | 33,470 | 33,496 | 33,445 |
| 2023 | 40 | 19,730 | 19,769 | 19,690 |
| 2024 | 43 | 49,178 | 49,221 | 49,135 |
| 2025 | 132 | 52,388 | 52,520 | 52,256 |
*) SITC = Standard International Trade Classification (classification system is maintained by the United Nations)
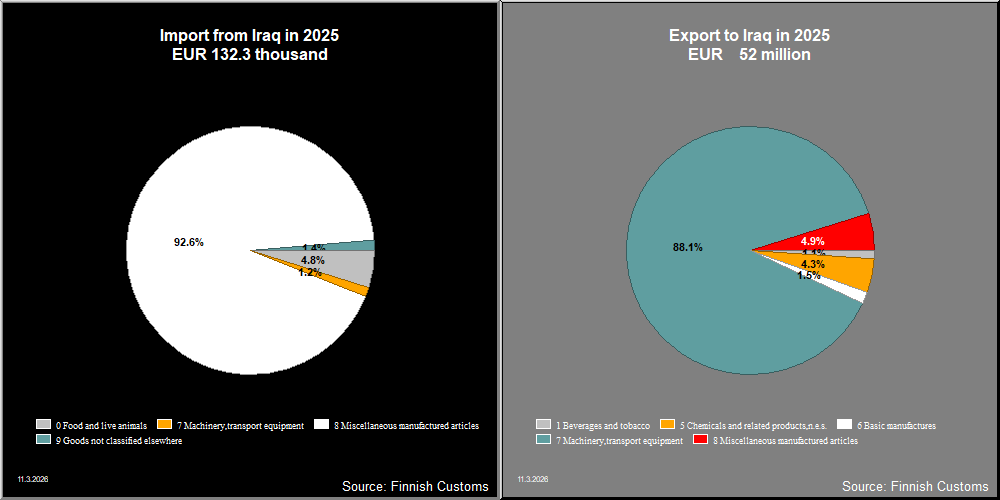

| 2021 | 2022 | 2023 | 2024 | 2025 | ||||||
|---|---|---|---|---|---|---|---|---|---|---|
| 1,000 € | % | 1,000 € | % | 1,000 € | % | 1,000 € | % | 1,000 € | % | |
| 0. Food and live animals | 15 | 0.3 | 20 | 0.1 | 19 | 0.1 | 8 | 0.0 | ||
| 01. Meat and meat preparations | 5 | 0.0 | 4 | 0.0 | 1 | 0.0 | ||||
| 02. Dairy products and birds' eggs | 1 | 0.0 | ||||||||
| 03. Fish and fish preparations | 9 | 0.0 | 2 | 0.0 | 1 | 0.0 | ||||
| 04. Cereals and cereal preparations | 6 | 0.0 | 4 | 0.0 | ||||||
| 07. Coffee,tea,cocoa,spices | 15 | 0.3 | 6 | 0.0 | 5 | 0.0 | 1 | 0.0 | ||
| 1. Beverages and tobacco | 374 | 6.3 | 602 | 1.8 | 710 | 3.6 | 229 | 0.5 | 561 | 1.1 |
| 11. Beverages | 374 | 6.3 | 602 | 1.8 | 710 | 3.6 | 229 | 0.5 | 561 | 1.1 |
| 2. Crude materials,inedible,except fuels | 583 | 9.7 | 1,576 | 4.7 | 871 | 4.4 | 81 | 0.2 | 22 | 0.0 |
| 23. Crude rubber (incl.synthetic) | 1 | 0.0 | ||||||||
| 24. Cork and wood | 582 | 9.7 | 1,575 | 4.7 | 871 | 4.4 | 80 | 0.2 | 22 | 0.0 |
| 26. Textile fibres and their wastes | 1 | 0.0 | ||||||||
| 27. Crude fertilizers and crude minerals | 1 | 0.0 | ||||||||
| 5. Chemicals and related products,n.e.s. | 1,231 | 20.6 | 880 | 2.6 | 1,378 | 7.0 | 2,034 | 4.5 | 2,269 | 4.3 |
| 51. Organic chemicals | 980 | 5.0 | 949 | 2.1 | 1,088 | 2.1 | ||||
| 52. Inorganic chemicals | 1 | 0.0 | 7 | 0.0 | 1 | 0.0 | 1 | 0.0 | 1 | 0.0 |
| 54. Medicinal and pharmaceutical products | 641 | 10.7 | 33 | 0.1 | ||||||
| 55. Perfume,cleaning etc.preparations | 100 | 1.7 | 12 | 0.0 | 23 | 0.1 | 2 | 0.0 | 4 | 0.0 |
| 57. Plastics in primary forms | 130 | 2.2 | 118 | 0.4 | 115 | 0.6 | 537 | 1.2 | 356 | 0.7 |
| 58. Plastics in non-primary forms | 9 | 0.1 | 21 | 0.1 | 6 | 0.0 | ||||
| 59. Chemical materials and products,n.e.s. | 351 | 5.9 | 689 | 2.1 | 259 | 1.3 | 537 | 1.2 | 819 | 1.6 |
| 6. Basic manufactures | 102 | 1.7 | 114 | 0.3 | 1,714 | 8.7 | 2,356 | 5.2 | 799 | 1.5 |
| 62. Rubber manufactures,n.e.s. | 10 | 0.2 | 13 | 0.0 | 52 | 0.3 | 146 | 0.3 | 6 | 0.0 |
| 63. Wood and cork manufactures | 9 | 0.0 | 30 | 0.1 | ||||||
| 64. Paper,paperboard and articles thereof | 25 | 0.4 | 85 | 0.3 | 1,603 | 8.1 | 2,167 | 4.7 | 312 | 0.6 |
| 66. Non-metallic mineral manufactures,n.e.s. | 13 | 0.2 | 2 | 0.0 | 2 | 0.0 | ||||
| 67. Iron and steel | 20 | 0.3 | 6 | 0.0 | ||||||
| 68. Non-ferrous metals | 40 | 0.2 | 6 | 0.0 | ||||||
| 69. Manufactures of metals,n.e.s. | 33 | 0.6 | 5 | 0.0 | 13 | 0.1 | 13 | 0.0 | 472 | 0.9 |
| 7. Machinery,transport equipment | 2,682 | 44.8 | 29,379 | 87.8 | 12,788 | 64.8 | 39,060 | 85.6 | 46,087 | 88.0 |
| 71. Power generating machinery and equipment | 375 | 6.3 | 24,812 | 74.1 | 168 | 0.9 | 4,350 | 9.5 | 20,080 | 38.3 |
| 72. Machinery for specialized industries | 585 | 9.8 | 980 | 2.9 | 3,098 | 15.7 | 11,848 | 26.0 | 4,267 | 8.1 |
| 73. Metal working machinery | 1 | 0.0 | ||||||||
| 74. General industrial machinery n.e.s. | 670 | 11.2 | 872 | 2.6 | 2,780 | 14.1 | 2,589 | 5.7 | 1,318 | 2.5 |
| 75. Office machines and adp machines | 17 | 0.3 | 23 | 0.1 | 5 | 0.0 | 20 | 0.0 | 40 | 0.1 |
| 76. Telecommunications and sound recording equipment | 175 | 2.9 | 872 | 2.6 | 212 | 1.1 | 298 | 0.7 | 513 | 1.0 |
| 77. Electric machinery,n.e.s.and parts | 642 | 10.7 | 1,261 | 3.8 | 2,314 | 11.7 | 1,193 | 2.6 | 1,879 | 3.6 |
| 78. Road vehicles | 73 | 1.2 | 559 | 1.7 | 3,946 | 20.0 | 18,762 | 41.1 | 17,991 | 34.3 |
| 79. Other transport equipment | 144 | 2.4 | 265 | 1.3 | ||||||
| 8. Miscellaneous manufactured articles | 998 | 16.7 | 898 | 2.7 | 2,251 | 11.4 | 1,748 | 3.8 | 2,580 | 4.9 |
| 81. Prefabr.buildings;sanitary,lighting etc.fixtrs | 5 | 0.1 | 5 | 0.0 | 10 | 0.0 | 223 | 0.5 | 67 | 0.1 |
| 82. Furniture and parts thereof | 1 | 0.0 | 1 | 0.0 | 10 | 0.0 | 3 | 0.0 | ||
| 84. Articles of apparel and clothing accessories | 3 | 0.0 | 2 | 0.0 | 1 | 0.0 | 2 | 0.0 | 1 | 0.0 |
| 87. Instruments and apparates n.e.s. | 972 | 16.2 | 723 | 2.2 | 2,025 | 10.3 | 1,496 | 3.3 | 2,275 | 4.3 |
| 88. Photographic equipment,optical goods etc. | 15 | 0.0 | 8 | 0.0 | 1 | 0.0 | ||||
| 89. Miscellaneous manufactured articles,n.e.s. | 17 | 0.3 | 153 | 0.5 | 205 | 1.0 | 16 | 0.0 | 234 | 0.4 |
| 9. Goods not classified elsewhere | 134 | 0.3 | 70 | 0.1 | ||||||
| 97. Gold,non-monetary | 50 | 0.1 | 134 | 0.3 | 70 | 0.1 | ||||
| All groups combined | 5,986 | 100.0 | 33,470 | 100.0 | 19,730 | 100.0 | 45,649 | 100.0 | 52,388 | 100.0 |

| 2021 | 2022 | 2023 | 2024 | 2025 | ||||||
|---|---|---|---|---|---|---|---|---|---|---|
| 1,000 € | % | 1,000 € | % | 1,000 € | % | 1,000 € | % | 1,000 € | % | |
| 0. Food and live animals | 15 | 36.3 | 13 | 30.1 | 6 | 4.8 | ||||
| 05. Vegetables and fruit | 3 | 7.2 | 10 | 22.8 | 1 | 0.7 | ||||
| 06. Sugars,sugar preparations and honey | 3 | 5.9 | 1 | 0.6 | ||||||
| 09. Miscellaneous edible products and preparations | 10 | 23.1 | 3 | 7.3 | 5 | 3.5 | ||||
| 2. Crude materials,inedible,except fuels | 1 | 4.9 | ||||||||
| 22. Oil seeds,oleaginous fruits | 1 | 3.2 | ||||||||
| 5. Chemicals and related products,n.e.s. | 1 | 1.2 | ||||||||
| 7. Machinery,transport equipment | 3 | 12.1 | 5 | 19.6 | 4 | 9.7 | 19 | 44.9 | 2 | 1.2 |
| 71. Power generating machinery and equipment | 1 | 4.8 | 1 | 3.4 | ||||||
| 74. General industrial machinery n.e.s. | 4 | 8.4 | ||||||||
| 75. Office machines and adp machines | 1 | 2.0 | ||||||||
| 76. Telecommunications and sound recording equipment | 1 | 2.3 | 2 | 7.1 | 1 | 1.0 | ||||
| 77. Electric machinery,n.e.s.and parts | 2 | 9.8 | 2 | 5.8 | 2 | 5.4 | 15 | 35.4 | ||
| 8. Miscellaneous manufactured articles | 17 | 65.0 | 14 | 51.9 | 19 | 45.3 | 10 | 22.4 | 122 | 92.3 |
| 81. Prefabr.buildings;sanitary,lighting etc.fixtrs | 1 | 2.1 | ||||||||
| 84. Articles of apparel and clothing accessories | 1 | 5.2 | 2 | 8.1 | 1 | 2.7 | ||||
| 87. Instruments and apparates n.e.s. | 5 | 18.9 | 10 | 39.3 | 1 | 2.7 | 4 | 9.6 | 18 | 13.9 |
| 88. Photographic equipment,optical goods etc. | 5 | 10.7 | ||||||||
| 89. Miscellaneous manufactured articles,n.e.s. | 10 | 40.7 | 17 | 39.8 | 103 | 77.7 | ||||
| 9. Goods not classified elsewhere | 4 | 16.4 | 7 | 26.2 | 3 | 6.5 | 3 | 7.5 | 2 | 1.4 |
| 93. Special transactions and commodities not classified | 4 | 16.4 | 7 | 26.2 | 3 | 6.5 | 3 | 7.5 | 2 | 1.4 |
| All groups combined | 25 | 100.0 | 26 | 100.0 | 42 | 100.0 | 43 | 100.0 | 132 | 100.0 |
| Classification | Description | Year level | Quarter level | Month level | |
|---|---|---|---|---|---|
| SITC | Standard International Trade Classification (classification system is maintained by the United Nations) | ███ | ███ | ███ | |
| BEC | The standard of statistical classification of BEC (Broad Economic Categories) is upheld by the UN and it is based on SITC-nomenclature. | ███ | ███ | ███ | |
| NACE | National industrial classification based on Statistical Classification of Economic Activities in the European Community Nomenclature générale des Activités économiques dans les Communautés européennes | ███ | ███ | ███ | |
| CPA | CPA = Classification of Products by Activities | ███ | ███ | ███ | |
| CN | The Combined Nomenclature is the common nomenclature of the European Community. | ███ | ███ | ███ |