
| Export of goods from Finland and import to Finland | Trade Balance |
The value of imports from India was 42.1 per cent higher than in Juli of the previous year, thus amounting now to €59 million. Major product categories of imports from India were Sitc 764 (telecommunications equipment, n.e.s., and parts, n.e.s., and accessories of apparatus falling within division 76), representing 14.4 per cent of imports, Sitc 542 (medicaments (including veterinary medicaments)) 11.2 % and Sitc 771 (electric power machinery (other than rotating electric plant of group 716) and parts thereof) 5.7 % of the imports.
Exports to India grew strongly over the previous year's Juli. The value of exports was €104 million. The largest product groups of exports were: Sitc 682 (copper), which represented a share of 22.2 per cent of total exports, Sitc 716 (rotating electric plant and parts thereof, n.e.s.) 13.9 % and Sitc 776 (thermionic, cold cathode or photo-cathode valves and tubes (e.g., vacuum or vapour or gas-filled valves and tubes, mercury arc rectifying valves and tubes, cathode-ray tubes, television camera tubes); diodes, transistors and similar semiconductor dev) 13.1 % of the exports.
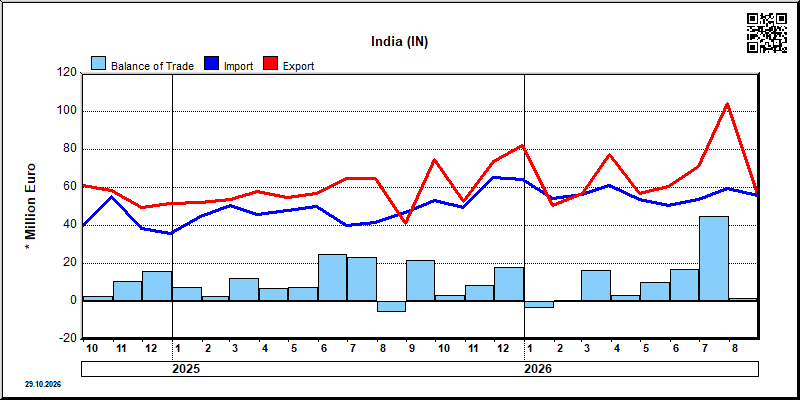
| Year | Month | Import 1,000 € | Export 1,000 € | Trade 1,000 € | Trade Balance 1,000 € |
|---|---|---|---|---|---|
| 2023 | 1 | 45,327 | 66,945 | 112,272 | 21,617 |
| 2023 | 2 | 41,974 | 70,921 | 112,895 | 28,947 |
| 2023 | 3 | 60,147 | 98,876 | 159,023 | 38,729 |
| 2023 | 4 | 53,462 | 97,149 | 150,611 | 43,687 |
| 2023 | 5 | 59,517 | 112,365 | 171,882 | 52,848 |
| 2023 | 6 | 46,887 | 76,543 | 123,430 | 29,656 |
| 2023 | 7 | 55,941 | 69,641 | 125,582 | 13,699 |
| 2023 | 8 | 48,648 | 64,578 | 113,227 | 15,930 |
| 2023 | 9 | 42,844 | 45,088 | 87,932 | 2,244 |
| 2023 | 10 | 40,772 | 44,100 | 84,872 | 3,328 |
| 2023 | 11 | 54,016 | 49,617 | 103,633 | -4,400 |
| 2023 | 12 | 41,493 | 47,188 | 88,680 | 5,695 |
| 2024 | 1 | 53,566 | 60,127 | 113,694 | 6,561 |
| 2024 | 2 | 56,487 | 50,083 | 106,570 | -6,404 |
| 2024 | 3 | 58,442 | 35,045 | 93,487 | -23,397 |
| 2024 | 4 | 62,031 | 55,593 | 117,624 | -6,438 |
| 2024 | 5 | 81,818 | 62,333 | 144,151 | -19,485 |
| 2024 | 6 | 71,307 | 75,799 | 147,106 | 4,492 |
| 2024 | 7 | 48,993 | 91,097 | 140,090 | 42,104 |
| 2024 | 8 | 44,039 | 60,633 | 104,672 | 16,594 |
| 2024 | 9 | 39,666 | 60,971 | 100,637 | 21,305 |
| 2024 | 10 | 55,489 | 58,332 | 113,821 | 2,843 |
| 2024 | 11 | 38,644 | 49,373 | 88,016 | 10,729 |
| 2024 | 12 | 35,774 | 51,601 | 87,375 | 15,827 |
| 2025 | 1 | 44,589 | 51,895 | 96,484 | 7,306 |
| 2025 | 2 | 50,748 | 53,463 | 104,211 | 2,715 |
| 2025 | 3 | 45,597 | 57,649 | 103,245 | 12,052 |
| 2025 | 4 | 48,156 | 54,789 | 102,945 | 6,634 |
| 2025 | 5 | 49,788 | 56,915 | 106,703 | 7,127 |
| 2025 | 6 | 40,182 | 64,970 | 105,152 | 24,788 |
| 2025 | 7 | 41,801 | 64,766 | 106,566 | 22,965 |
| 2025 | 8 | 46,938 | 41,176 | 88,115 | -5,762 |
| 2025 | 9 | 53,345 | 74,916 | 128,261 | 21,572 |
| 2025 | 10 | 49,426 | 52,570 | 101,996 | 3,144 |
| 2025 | 11 | 65,376 | 73,766 | 139,142 | 8,391 |
| 2025 | 12 | 63,962 | 81,966 | 145,928 | 18,005 |
| 2026 | 1 | 53,798 | 50,507 | 104,305 | -3,291 |
| 2026 | 2 | 56,162 | 56,727 | 112,889 | 565 |
| 2026 | 3 | 61,054 | 77,189 | 138,243 | 16,135 |
| 2026 | 4 | 53,655 | 56,732 | 110,388 | 3,077 |
| 2026 | 5 | 50,853 | 60,962 | 111,815 | 10,109 |
| 2026 | 6 | 54,089 | 70,895 | 124,984 | 16,806 |
| 2026 | 7 | 59,391 | 104,170 | 163,561 | 44,779 |

| 2026/3 | 2026/4 | 2026/5 | 2026/6 | 2026/7 | ||||||
|---|---|---|---|---|---|---|---|---|---|---|
| 1000 € | % | 1000 € | % | 1000 € | % | 1000 € | % | 1000 € | % | |
| 0. Food and live animals | 315 | 0.4 | 524 | 0.9 | 107 | 0.2 | 76 | 0.1 | 25 | 0.0 |
| 2. Crude materials,inedible,except fuels | 7,883 | 10.2 | 6,156 | 10.9 | 8,153 | 13.4 | 7,183 | 10.1 | 7,798 | 7.5 |
| 3. Mineral fuels etc | 341 | 0.4 | 136 | 0.2 | 347 | 0.6 | 137 | 0.2 | 1 | 0.0 |
| 5. Chemicals and related products,n.e.s. | 8,101 | 10.5 | 7,454 | 13.1 | 4,978 | 8.2 | 11,497 | 16.2 | 8,232 | 7.9 |
| 6. Basic manufactures | 8,096 | 10.5 | 9,243 | 16.3 | 7,878 | 12.9 | 8,814 | 12.4 | 32,320 | 31.0 |
| 7. Machinery,transport equipment | 45,736 | 59.3 | 29,356 | 51.7 | 34,630 | 56.8 | 38,745 | 54.7 | 49,991 | 48.0 |
| 8. Miscellaneous manufactured articles | 6,717 | 8.7 | 3,863 | 6.8 | 4,870 | 8.0 | 4,441 | 6.3 | 5,802 | 5.6 |
| All groups combined | 77,189 | 100.0 | 56,732 | 100.0 | 60,962 | 100.0 | 70,895 | 100.0 | 104,170 | 100.0 |

| 2026/3 | 2026/4 | 2026/5 | 2026/6 | 2026/7 | ||||||
|---|---|---|---|---|---|---|---|---|---|---|
| 1000 € | % | 1000 € | % | 1000 € | % | 1000 € | % | 1000 € | % | |
| 0. Food and live animals | 1,634 | 2.7 | 2,572 | 4.8 | 2,990 | 5.9 | 1,752 | 3.2 | 2,068 | 3.5 |
| 1. Beverages and tobacco | 1 | 0.0 | 1 | 0.0 | ||||||
| 2. Crude materials,inedible,except fuels | 1,002 | 1.6 | 873 | 1.6 | 806 | 1.6 | 330 | 0.6 | 667 | 1.1 |
| 3. Mineral fuels etc | 2 | 0.0 | 51 | 0.1 | 3 | 0.0 | 69 | 0.1 | ||
| 4. Animal and vegetable oils and fats | 29 | 0.0 | 152 | 0.3 | 180 | 0.4 | 157 | 0.3 | 159 | 0.3 |
| 5. Chemicals and related products,n.e.s. | 13,891 | 22.8 | 10,333 | 19.3 | 10,696 | 21.0 | 10,387 | 19.2 | 12,178 | 20.5 |
| 6. Basic manufactures | 11,701 | 19.2 | 9,740 | 18.2 | 9,333 | 18.4 | 11,039 | 20.4 | 10,061 | 16.9 |
| 7. Machinery,transport equipment | 20,589 | 33.7 | 20,944 | 39.0 | 17,749 | 34.9 | 20,780 | 38.4 | 24,768 | 41.7 |
| 8. Miscellaneous manufactured articles | 12,160 | 19.9 | 8,994 | 16.8 | 9,011 | 17.7 | 9,597 | 17.7 | 9,395 | 15.8 |
| 9. Goods not classified elsewhere | 46 | 0.1 | 48 | 0.1 | 39 | 0.1 | 41 | 0.1 | 25 | 0.0 |
| All groups combined | 61,054 | 100.0 | 53,655 | 100.0 | 50,853 | 100.0 | 54,089 | 100.0 | 59,391 | 100.0 |
| Classification | Description | Year level | Quarter level | Month level | Year 2026 sofar |
|---|---|---|---|---|---|
| SITC | Standard International Trade Classification (classification system is maintained by the United Nations) | ███ | ███ | ███ | ███ |
| BEC | The standard of statistical classification of BEC (Broad Economic Categories) is upheld by the UN and it is based on SITC-nomenclature. | ███ | ███ | ███ | ███ |
| NACE | National industrial classification based on Statistical Classification of Economic Activities in the European Community Nomenclature générale des Activités économiques dans les Communautés européennes | ███ | ███ | ███ | ███ |
| CPA | CPA = Classification of Products by Activities | ███ | ███ | ███ | ███ |
| CN | The Combined Nomenclature is the common nomenclature of the European Community. | ███ | ███ | ███ | ███ |