
| Export of goods from Finland and import to Finland | BEC (Broad Economic Categories) |
*) The standard of statistical classification of BEC (Broad Economic Categories) is upheld by the UN and it is based on SITC-nomenclature.

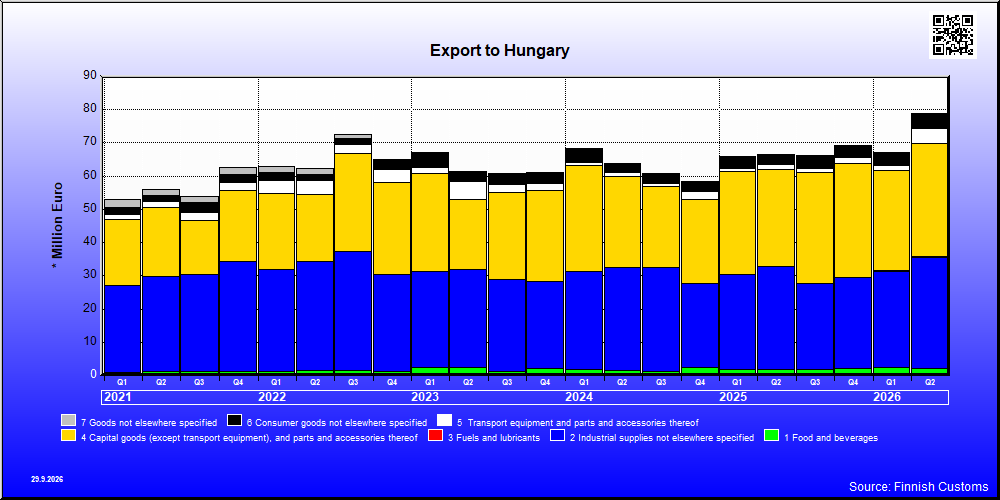
| Q2 / 2026 | Q2 / 2025 | Muutos edellisestä vastaavasta kaudesta % | ||
|---|---|---|---|---|
| 1,000 € | % | 1,000 € | ||
| 1. Food and beverages | 1,970 | 2.5 | 1,842 | 6.9 |
| 11. Food and beverages, primary | 162 | 0.2 | 221 | -26.6 |
| 112. Food and beverages, primary, mainly for household consumption | 162 | 0.2 | 221 | -26.6 |
| 12. Food and beverages, processed | 1,808 | 2.3 | 1,621 | 11.5 |
| 121. Food and beverages, processed, mainly for industry | 45 | 0.1 | 79 | -42.4 |
| 122. Food and beverages, processed, mainly for household consumption | 1,762 | 2.2 | 1,542 | 14.3 |
| 2. Industrial supplies not elsewhere specified | 33,660 | 42.6 | 30,938 | 8.8 |
| 21. Industrial supplies not elsewhere specified, primary | 462 | 0.6 | 433 | 6.7 |
| 22. Industrial supplies not elsewhere specified, processed | 33,198 | 42.0 | 30,505 | 8.8 |
| 3. Fuels and lubricants | 98 | 0.1 | 3 | .. |
| 32. Fuels and lubricants, processed | 98 | 0.1 | 3 | .. |
| 322. Fuels and lubricants, other | 98 | 0.1 | 3 | .. |
| 4. Capital goods (except transport equipment), and parts and accessories thereof | 34,195 | 43.3 | 29,143 | 17.3 |
| 41. Capital goods (except transport equipment) | 15,858 | 20.1 | 13,380 | 18.5 |
| 42. Capital goods (except transport equipment), parts and accessories | 18,337 | 23.2 | 15,763 | 16.3 |
| 5. Transport equipment and parts and accessories thereof | 4,571 | 5.8 | 1,629 | 180.5 |
| 51. Passenger motor vehicles | 602 | 0.8 | 0 | .. |
| 52. Transport equipment, other than passenger motor vehicles | 2,890 | 3.7 | 643 | 349.4 |
| 521. Transport equipment, other than passenger motor vehicles, industrial | 2,855 | 3.6 | 570 | 400.7 |
| 522. Transport equipment, other than passenger motor vehicles, non-industrial | 35 | 0.0 | 73 | -52.0 |
| 53. Transport equipment, parts and accessories | 1,080 | 1.4 | 986 | 9.5 |
| 6. Consumer goods not elsewhere specified | 4,267 | 5.4 | 2,870 | 48.7 |
| 61. Consumer goods not elsewhere specified, durable | 173 | 0.2 | 204 | -15.2 |
| 62. Consumer goods not elsewhere specified, semi-durable | 654 | 0.8 | 696 | -6.1 |
| 63. Consumer goods not elsewhere specified, non-durable | 3,440 | 4.4 | 1,970 | 74.7 |
| 7. Goods not elsewhere specified | 215 | 0.3 | 113 | 89.8 |
| All groups | 78,977 | 100.0 | 66,538 | 18.7 |

| Q2 / 2026 | Q2 / 2025 | Muutos edellisestä vastaavasta kaudesta % | ||
|---|---|---|---|---|
| 1,000 € | % | 1,000 € | ||
| 1. Food and beverages | 14,485 | 8.9 | 9,482 | 52.8 |
| 11. Food and beverages, primary | 2,035 | 1.3 | 1,887 | 7.8 |
| 111. Food and beverages, primary, mainly for industry | 76 | 0.0 | 1 | .. |
| 112. Food and beverages, primary, mainly for household consumption | 1,959 | 1.2 | 1,887 | 3.8 |
| 12. Food and beverages, processed | 12,450 | 7.7 | 7,595 | 63.9 |
| 121. Food and beverages, processed, mainly for industry | 1,047 | 0.6 | 613 | 70.8 |
| 122. Food and beverages, processed, mainly for household consumption | 11,402 | 7.0 | 6,982 | 63.3 |
| 2. Industrial supplies not elsewhere specified | 21,654 | 13.3 | 19,732 | 9.7 |
| 21. Industrial supplies not elsewhere specified, primary | 169 | 0.1 | 417 | -59.5 |
| 22. Industrial supplies not elsewhere specified, processed | 21,485 | 13.2 | 19,314 | 11.2 |
| 3. Fuels and lubricants | 8 | 0.0 | 121 | -93.7 |
| 32. Fuels and lubricants, processed | 8 | 0.0 | 121 | -93.7 |
| 322. Fuels and lubricants, other | 8 | 0.0 | 121 | -93.7 |
| 4. Capital goods (except transport equipment), and parts and accessories thereof | 44,113 | 27.2 | 27,160 | 62.4 |
| 41. Capital goods (except transport equipment) | 26,036 | 16.0 | 16,029 | 62.4 |
| 42. Capital goods (except transport equipment), parts and accessories | 18,078 | 11.1 | 11,132 | 62.4 |
| 5. Transport equipment and parts and accessories thereof | 58,640 | 36.1 | 47,981 | 22.2 |
| 51. Passenger motor vehicles | 38,002 | 23.4 | 16,771 | 126.6 |
| 52. Transport equipment, other than passenger motor vehicles | 9,377 | 5.8 | 10,096 | -7.1 |
| 521. Transport equipment, other than passenger motor vehicles, industrial | 6 | 0.0 | 7 | -16.8 |
| 522. Transport equipment, other than passenger motor vehicles, non-industrial | 9,372 | 5.8 | 10,089 | -7.1 |
| 53. Transport equipment, parts and accessories | 11,261 | 6.9 | 21,114 | -46.7 |
| 6. Consumer goods not elsewhere specified | 23,518 | 14.5 | 29,166 | -19.4 |
| 61. Consumer goods not elsewhere specified, durable | 4,786 | 2.9 | 12,548 | -61.9 |
| 62. Consumer goods not elsewhere specified, semi-durable | 6,179 | 3.8 | 8,159 | -24.3 |
| 63. Consumer goods not elsewhere specified, non-durable | 12,554 | 7.7 | 8,459 | 48.4 |
| 7. Goods not elsewhere specified | 18 | 0.0 | 328 | -94.6 |
| All groups | 162,436 | 100.0 | 133,970 | 21.2 |
| Classification | Description | Year level | Quarter level | Month level | Year 2026 sofar |
|---|---|---|---|---|---|
| SITC | Standard International Trade Classification (classification system is maintained by the United Nations) | ███ | ███ | ███ | ███ |
| BEC | The standard of statistical classification of BEC (Broad Economic Categories) is upheld by the UN and it is based on SITC-nomenclature. | ███ | ███ | ███ | ███ |
| NACE | National industrial classification based on Statistical Classification of Economic Activities in the European Community Nomenclature générale des Activités économiques dans les Communautés européennes | ███ | ███ | ███ | ███ |
| CPA | CPA = Classification of Products by Activities | ███ | ███ | ███ | ███ |
| CN | The Combined Nomenclature is the common nomenclature of the European Community. | ███ | ███ | ███ | ███ |