
| Export of goods from Finland and import to Finland | Trade Balance |

| Year | Import 1,000 € | Export 1,000 € | Trade 1,000 € | Trade balance 1,000 € |
|---|---|---|---|---|
| 2002 | 1,140 | 273 | 1,413 | -867 |
| 2003 | 3,875 | 164 | 4,039 | -3,711 |
| 2004 | 140 | 1,084 | 1,224 | 944 |
| 2005 | 153 | 146 | 299 | -7 |
| 2006 | 156 | 4,892 | 5,048 | 4,736 |
| 2007 | 147 | 1,017 | 1,164 | 870 |
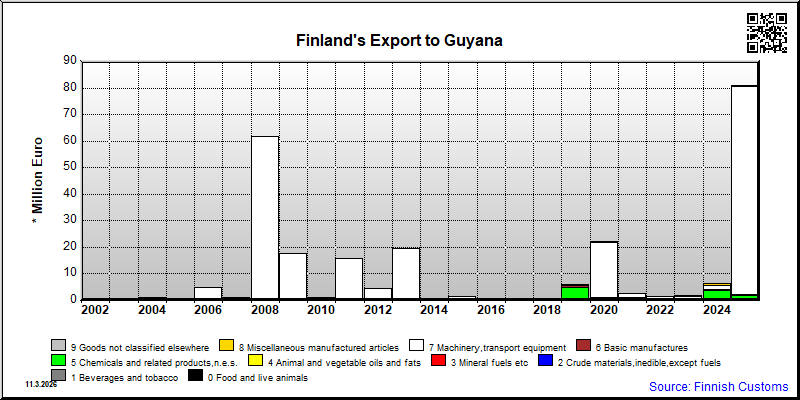
| 2008 | 113 | 61,591 | 61,704 | 61,477 |
| 2009 | 90 | 17,697 | 17,787 | 17,607 |
| 2010 | 116 | 957 | 1,074 | 841 |
| 2011 | 171 | 15,876 | 16,047 | 15,705 |
| 2012 | 255 | 4,699 | 4,954 | 4,444 |
| 2013 | 358 | 19,505 | 19,863 | 19,147 |
| 2014 | 143 | 716 | 859 | 573 |
| 2015 | 51 | 1,661 | 1,712 | 1,610 |
| 2016 | 328 | 516 | 844 | 188 |
| 2017 | 204 | 298 | 502 | 93 |
| 2018 | 191 | 641 | 832 | 450 |
| 2019 | 403 | 5,904 | 6,307 | 5,501 |
| 2020 | 235 | 22,039 | 22,273 | 21,804 |
| 2021 | 379 | 2,687 | 3,066 | 2,309 |
| 2022 | 478 | 1,430 | 1,907 | 952 |
| 2023 | 48,222 | 1,805 | 50,028 | -46,417 |
| 2024 | 145,832 | 6,400 | 152,232 | -139,432 |
| 2025 | 88,894 | 81,013 | 169,907 | -7,881 |
*) SITC = Standard International Trade Classification (classification system is maintained by the United Nations)

| 2021 | 2022 | 2023 | 2024 | 2025 | ||||||
|---|---|---|---|---|---|---|---|---|---|---|
| 1,000 € | % | 1,000 € | % | 1,000 € | % | 1,000 € | % | 1,000 € | % | |
| 2. Crude materials,inedible,except fuels | 2 | 0.1 | ||||||||
| 28. Metalliferous ores and metal scrap | 2 | 0.1 | ||||||||
| 5. Chemicals and related products,n.e.s. | 1,016 | 37.8 | 12 | 0.8 | 820 | 45.4 | 3,778 | 59.9 | 1,723 | 2.1 |
| 54. Medicinal and pharmaceutical products | 3 | 0.1 | 4 | 0.3 | ||||||
| 55. Perfume,cleaning etc.preparations | 3 | 0.1 | ||||||||
| 57. Plastics in primary forms | 1,010 | 37.6 | 820 | 45.4 | 3,776 | 59.9 | 1,723 | 2.1 | ||
| 58. Plastics in non-primary forms | 2 | 0.1 | 2 | 0.0 | ||||||
| 59. Chemical materials and products,n.e.s. | 6 | 0.4 | ||||||||
| 6. Basic manufactures | 16 | 0.6 | 101 | 7.0 | 14 | 0.8 | 514 | 8.1 | 467 | 0.6 |
| 62. Rubber manufactures,n.e.s. | 1 | 0.0 | 2 | 0.2 | ||||||
| 64. Paper,paperboard and articles thereof | 84 | 5.9 | 11 | 0.2 | ||||||
| 65. Textile yarn,fabrics,made up articles,etc. | 9 | 0.5 | 1 | 0.0 | ||||||
| 66. Non-metallic mineral manufactures,n.e.s. | 64 | 1.0 | ||||||||
| 67. Iron and steel | 4 | 0.2 | ||||||||
| 69. Manufactures of metals,n.e.s. | 15 | 0.5 | 10 | 0.7 | 6 | 0.3 | 437 | 6.9 | 467 | 0.6 |
| 7. Machinery,transport equipment | 1,475 | 54.9 | 1,225 | 85.7 | 720 | 39.9 | 1,427 | 22.6 | 78,540 | 96.9 |
| 71. Power generating machinery and equipment | 12 | 0.5 | 543 | 38.0 | 138 | 7.6 | 206 | 3.3 | 77,245 | 95.3 |
| 72. Machinery for specialized industries | 139 | 5.2 | 359 | 25.1 | 384 | 21.3 | 390 | 6.2 | 1,085 | 1.3 |
| 74. General industrial machinery n.e.s. | 36 | 1.4 | 77 | 5.4 | 125 | 6.9 | 712 | 11.3 | 50 | 0.1 |
| 75. Office machines and adp machines | 3 | 0.2 | 10 | 0.6 | 30 | 0.5 | 2 | 0.0 | ||
| 76. Telecommunications and sound recording equipment | 1,283 | 47.7 | 4 | 0.3 | 19 | 1.0 | 17 | 0.3 | 13 | 0.0 |
| 77. Electric machinery,n.e.s.and parts | 4 | 0.1 | 185 | 12.9 | 44 | 2.5 | 71 | 1.1 | 146 | 0.2 |
| 79. Other transport equipment | 55 | 3.8 | ||||||||
| 8. Miscellaneous manufactured articles | 179 | 6.7 | 92 | 6.5 | 251 | 13.9 | 584 | 9.3 | 283 | 0.3 |
| 82. Furniture and parts thereof | 2 | 0.2 | ||||||||
| 84. Articles of apparel and clothing accessories | 1 | 0.0 | 7 | 0.1 | ||||||
| 85. Footwear | 2 | 0.1 | 4 | 0.3 | 5 | 0.3 | 3 | 0.0 | 6 | 0.0 |
| 87. Instruments and apparates n.e.s. | 177 | 6.6 | 85 | 5.9 | 241 | 13.3 | 573 | 9.1 | 276 | 0.3 |
| 88. Photographic equipment,optical goods etc. | 1 | 0.0 | ||||||||
| 89. Miscellaneous manufactured articles,n.e.s. | 4 | 0.2 | 2 | 0.0 | ||||||
| All groups combined | 2,687 | 100.0 | 1,430 | 100.0 | 1,805 | 100.0 | 6,303 | 100.0 | 81,014 | 100.0 |

| 2021 | 2022 | 2023 | 2024 | 2025 | ||||||
|---|---|---|---|---|---|---|---|---|---|---|
| 1,000 € | % | 1,000 € | % | 1,000 € | % | 1,000 € | % | 1,000 € | % | |
| 0. Food and live animals | 2 | 0.0 | ||||||||
| 03. Fish and fish preparations | 2 | 0.0 | ||||||||
| 1. Beverages and tobacco | 373 | 98.6 | 471 | 98.7 | 617 | 1.3 | 707 | 0.5 | 295 | 0.3 |
| 11. Beverages | 373 | 98.6 | 471 | 98.7 | 617 | 1.3 | 707 | 0.5 | 295 | 0.3 |
| 3. Mineral fuels etc | 47,543 | 98.7 | 145,122 | 99.5 | 88,473 | 99.5 | ||||
| 33. Petroleum and products | 47,543 | 98.7 | 145,122 | 99.5 | 88,473 | 99.5 | ||||
| 7. Machinery,transport equipment | 5 | 1.1 | 2 | 0.0 | 4 | 0.0 | 124 | 0.1 | ||
| 71. Power generating machinery and equipment | 3 | 0.6 | ||||||||
| 74. General industrial machinery n.e.s. | 1 | 0.0 | ||||||||
| 77. Electric machinery,n.e.s.and parts | 2 | 0.5 | 2 | 0.0 | 3 | 0.0 | 124 | 0.1 | ||
| 8. Miscellaneous manufactured articles | 5 | 1.3 | 1 | 0.2 | ||||||
| 87. Instruments and apparates n.e.s. | 5 | 1.3 | 1 | 0.2 | ||||||
| 9. Goods not classified elsewhere | 1 | 0.1 | ||||||||
| 93. Special transactions and commodities not classified | 1 | 0.1 | ||||||||
| All groups combined | 379 | 100.0 | 478 | 100.0 | 48,162 | 100.0 | 145,832 | 100.0 | 88,894 | 100.0 |
| Classification | Description | Year level | Quarter level | Month level | |
|---|---|---|---|---|---|
| SITC | Standard International Trade Classification (classification system is maintained by the United Nations) | ███ | |||
| BEC | The standard of statistical classification of BEC (Broad Economic Categories) is upheld by the UN and it is based on SITC-nomenclature. | ███ | |||
| NACE | National industrial classification based on Statistical Classification of Economic Activities in the European Community Nomenclature générale des Activités économiques dans les Communautés européennes | ███ | |||
| CPA | CPA = Classification of Products by Activities | ███ | |||
| CN | The Combined Nomenclature is the common nomenclature of the European Community. | ███ |