
| Export of goods from Finland and import to Finland | Trade Balance |

| Year | Month | Import 1,000 € | Export 1,000 € | Trade 1,000 € | Trade Balance 1,000 € |
|---|---|---|---|---|---|
| 2023 | 1 | 590 | 2,858 | 3,448 | 2,268 |
| 2023 | 2 | 656 | 2,497 | 3,154 | 1,841 |
| 2023 | 3 | 1,273 | 7,049 | 8,322 | 5,776 |
| 2023 | 4 | 1,654 | 1,745 | 3,398 | 91 |
| 2023 | 5 | 6,880 | 3,696 | 10,576 | -3,184 |
| 2023 | 6 | 7,001 | 1,059 | 8,060 | -5,942 |
| 2023 | 7 | 891 | 1,099 | 1,990 | 208 |
| 2023 | 8 | 584 | 581 | 1,165 | -3 |
| 2023 | 9 | 461 | 879 | 1,341 | 418 |
| 2023 | 10 | 753 | 2,514 | 3,267 | 1,762 |
| 2023 | 11 | 504 | 5,273 | 5,777 | 4,768 |
| 2023 | 12 | 786 | 2,726 | 3,512 | 1,940 |
| 2024 | 1 | 435 | 4,787 | 5,222 | 4,351 |
| 2024 | 2 | 669 | 3,923 | 4,592 | 3,253 |
| 2024 | 3 | 659 | 836 | 1,496 | 177 |
| 2024 | 4 | 1,095 | 4,512 | 5,607 | 3,417 |
| 2024 | 5 | 1,171 | 2,933 | 4,104 | 1,762 |
| 2024 | 6 | 1,424 | 3,522 | 4,946 | 2,097 |
| 2024 | 7 | 2,904 | 3,911 | 6,815 | 1,007 |
| 2024 | 8 | 1,886 | 3,146 | 5,032 | 1,260 |
| 2024 | 9 | 950 | 4,906 | 5,856 | 3,956 |
| 2024 | 10 | 460 | 3,270 | 3,730 | 2,810 |
| 2024 | 11 | 1,033 | 5,638 | 6,670 | 4,605 |
| 2024 | 12 | 499 | 4,874 | 5,373 | 4,375 |
| 2025 | 1 | 781 | 6,458 | 7,239 | 5,677 |
| 2025 | 2 | 571 | 2,607 | 3,178 | 2,036 |
| 2025 | 3 | 1,316 | 3,366 | 4,682 | 2,051 |
| 2025 | 4 | 1,200 | 2,757 | 3,956 | 1,557 |
| 2025 | 5 | 1,827 | 4,048 | 5,875 | 2,222 |
| 2025 | 6 | 3,477 | 5,509 | 8,986 | 2,031 |
| 2025 | 7 | 5,460 | 5,150 | 10,609 | -310 |
| 2025 | 8 | 2,804 | 5,764 | 8,568 | 2,959 |
| 2025 | 9 | 1,858 | 4,336 | 6,193 | 2,478 |
| 2025 | 10 | 1,691 | 5,367 | 7,057 | 3,676 |
| 2025 | 11 | 1,529 | 4,061 | 5,590 | 2,533 |
| 2025 | 12 | 1,241 | 3,115 | 4,356 | 1,874 |
| 2026 | 1 | 522 | 4,472 | 4,994 | 3,950 |
| 2026 | 2 | 2,146 | 4,543 | 6,689 | 2,397 |
| 2026 | 3 | 4,190 | 4,251 | 8,440 | 61 |
| 2026 | 4 | 1,368 | 5,232 | 6,600 | 3,864 |
| 2026 | 5 | 1,808 | 5,563 | 7,370 | 3,755 |
| 2026 | 6 | 1,463 | 5,698 | 7,161 | 4,234 |
| 2026 | 7 | 1,833 | 7,533 | 9,367 | 5,700 |
| 2026 | 8 | 1,902 | 6,882 | 8,784 | 4,980 |
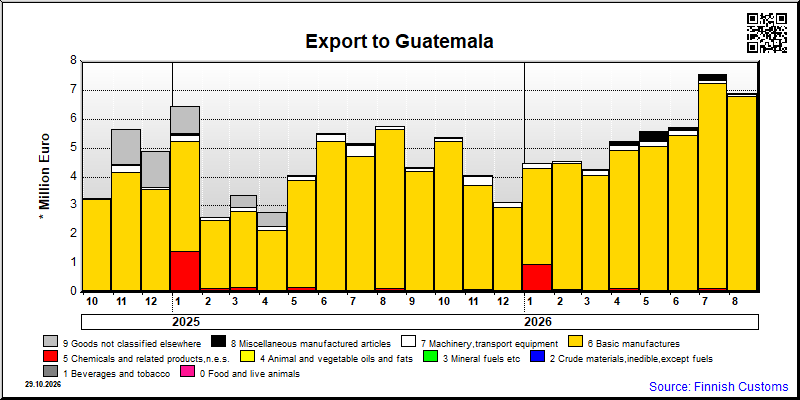
| 2026/4 | 2026/5 | 2026/6 | 2026/7 | 2026/8 | ||||||
|---|---|---|---|---|---|---|---|---|---|---|
| 1000 € | % | 1000 € | % | 1000 € | % | 1000 € | % | 1000 € | % | |
| 1. Beverages and tobacco | 36 | 0.5 | ||||||||
| 3. Mineral fuels etc | 17 | 0.3 | ||||||||
| 5. Chemicals and related products,n.e.s. | 132 | 2.5 | 55 | 1.0 | 21 | 0.4 | 95 | 1.3 | 4 | 0.1 |
| 6. Basic manufactures | 4,774 | 91.3 | 5,016 | 90.2 | 5,401 | 94.8 | 7,098 | 94.2 | 6,781 | 98.5 |
| 7. Machinery,transport equipment | 173 | 3.3 | 167 | 3.0 | 178 | 3.1 | 112 | 1.5 | 74 | 1.1 |
| 8. Miscellaneous manufactured articles | 153 | 2.9 | 324 | 5.8 | 81 | 1.4 | 192 | 2.6 | 22 | 0.3 |
| All groups combined | 5,232 | 100.0 | 5,563 | 100.0 | 5,698 | 100.0 | 7,533 | 100.0 | 6,882 | 100.0 |

| 2026/4 | 2026/5 | 2026/6 | 2026/7 | 2026/8 | ||||||
|---|---|---|---|---|---|---|---|---|---|---|
| 1000 € | % | 1000 € | % | 1000 € | % | 1000 € | % | 1000 € | % | |
| 0. Food and live animals | 1,184 | 86.5 | 1,620 | 89.6 | 1,363 | 93.1 | 1,575 | 85.9 | 1,704 | 89.6 |
| 1. Beverages and tobacco | 15 | 1.1 | 2 | 0.1 | 8 | 0.5 | 19 | 1.0 | 5 | 0.3 |
| 2. Crude materials,inedible,except fuels | 88 | 6.4 | 44 | 2.5 | 54 | 3.7 | 149 | 8.1 | 114 | 6.0 |
| 5. Chemicals and related products,n.e.s. | 45 | 3.3 | 3 | 0.2 | 1 | 0.0 | ||||
| 7. Machinery,transport equipment | 1 | 0.1 | 1 | 0.0 | 1 | 0.1 | 17 | 0.9 | ||
| 8. Miscellaneous manufactured articles | 35 | 2.5 | 140 | 7.8 | 37 | 2.6 | 71 | 3.8 | 78 | 4.1 |
| 9. Goods not classified elsewhere | ||||||||||
| All groups combined | 1,368 | 100.0 | 1,808 | 100.0 | 1,463 | 100.0 | 1,833 | 100.0 | 1,902 | 100.0 |
| Classification | Description | Year level | Quarter level | Month level | Year 2026 sofar |
|---|---|---|---|---|---|
| SITC | Standard International Trade Classification (classification system is maintained by the United Nations) | ███ | ███ | ███ | ███ |
| BEC | The standard of statistical classification of BEC (Broad Economic Categories) is upheld by the UN and it is based on SITC-nomenclature. | ███ | ███ | ███ | ███ |
| NACE | National industrial classification based on Statistical Classification of Economic Activities in the European Community Nomenclature générale des Activités économiques dans les Communautés européennes | ███ | ███ | ███ | ███ |
| CPA | CPA = Classification of Products by Activities | ███ | ███ | ███ | ███ |
| CN | The Combined Nomenclature is the common nomenclature of the European Community. | ███ | ███ | ███ | ███ |