
| Export of goods from Finland and import to Finland | Trade Balance |

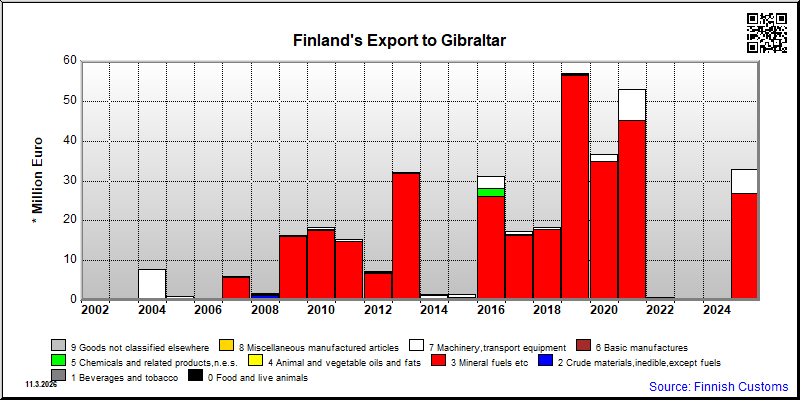
| Year | Import 1,000 € | Export 1,000 € | Trade 1,000 € | Trade balance 1,000 € |
|---|---|---|---|---|
| 2002 | 11 | 180 | 191 | 169 |
| 2003 | 252 | 297 | 549 | 45 |
| 2004 | 302 | 7,855 | 8,157 | 7,553 |
| 2005 | 3 | 956 | 959 | 953 |
| 2006 | 6 | 174 | 180 | 169 |
| 2007 | 2 | 6,087 | 6,088 | 6,085 |
| 2008 | 4 | 1,863 | 1,867 | 1,859 |
| 2009 | 1 | 16,384 | 16,385 | 16,383 |
| 2010 | 0 | 18,389 | 18,390 | 18,389 |
| 2011 | 0 | 15,379 | 15,379 | 15,379 |
| 2012 | 3 | 7,304 | 7,308 | 7,301 |
| 2013 | 2 | 32,159 | 32,161 | 32,156 |
| 2014 | 1 | 1,479 | 1,480 | 1,479 |
| 2015 | 152 | 1,599 | 1,752 | 1,447 |
| 2016 | 140 | 31,234 | 31,374 | 31,094 |
| 2017 | 0 | 17,321 | 17,321 | 17,321 |
| 2018 | 7 | 18,265 | 18,272 | 18,259 |
| 2019 | 8 | 56,874 | 56,882 | 56,866 |
| 2020 | 11 | 36,574 | 36,585 | 36,563 |
| 2021 | 9 | 52,887 | 52,896 | 52,877 |
| 2022 | 2 | 707 | 710 | 705 |
| 2023 | 14 | 552 | 566 | 538 |
| 2024 | 1 | 367 | 368 | 366 |
| 2025 | 1 | 32,983 | 32,985 | 32,982 |
*) SITC = Standard International Trade Classification (classification system is maintained by the United Nations)

| 2021 | 2022 | 2023 | 2024 | 2025 | ||||||
|---|---|---|---|---|---|---|---|---|---|---|
| 1,000 € | % | 1,000 € | % | 1,000 € | % | 1,000 € | % | 1,000 € | % | |
| 1. Beverages and tobacco | 14 | 0.0 | 16 | 2.2 | 22 | 3.9 | 40 | 10.9 | 42 | 0.1 |
| 11. Beverages | 14 | 0.0 | 16 | 2.2 | 22 | 3.9 | 40 | 10.9 | 42 | 0.1 |
| 3. Mineral fuels etc | 45,202 | 85.5 | 26,704 | 81.0 | ||||||
| 33. Petroleum and products | 45,202 | 85.5 | 26,704 | 81.0 | ||||||
| 5. Chemicals and related products,n.e.s. | 1 | 0.0 | 14 | 2.6 | 12 | 0.0 | ||||
| 52. Inorganic chemicals | 5 | 1.0 | 11 | 0.0 | ||||||
| 58. Plastics in non-primary forms | 1 | 0.0 | ||||||||
| 59. Chemical materials and products,n.e.s. | 9 | 1.6 | ||||||||
| 6. Basic manufactures | 16 | 0.0 | 9 | 1.3 | 10 | 1.8 | 3 | 0.7 | 19 | 0.1 |
| 66. Non-metallic mineral manufactures,n.e.s. | 1 | 0.0 | ||||||||
| 68. Non-ferrous metals | 1 | 0.0 | ||||||||
| 69. Manufactures of metals,n.e.s. | 14 | 0.0 | 9 | 1.2 | 10 | 1.8 | 2 | 0.6 | 18 | 0.1 |
| 7. Machinery,transport equipment | 7,645 | 14.5 | 675 | 95.4 | 476 | 86.3 | 312 | 84.9 | 6,155 | 18.7 |
| 71. Power generating machinery and equipment | 6 | 0.0 | 145 | 0.4 | ||||||
| 72. Machinery for specialized industries | 2 | 0.0 | 201 | 36.4 | ||||||
| 74. General industrial machinery n.e.s. | 49 | 0.1 | 16 | 2.3 | 227 | 41.1 | 40 | 10.9 | 173 | 0.5 |
| 76. Telecommunications and sound recording equipment | 101 | 0.2 | 186 | 26.2 | 19 | 3.4 | 224 | 61.2 | 5 | 0.0 |
| 77. Electric machinery,n.e.s.and parts | 9 | 0.0 | 16 | 2.3 | 30 | 5.4 | 47 | 12.8 | 161 | 0.5 |
| 78. Road vehicles | 7 | 0.9 | ||||||||
| 79. Other transport equipment | 7,478 | 14.1 | 450 | 63.6 | 5,671 | 17.2 | ||||
| 8. Miscellaneous manufactured articles | 9 | 0.0 | 7 | 1.0 | 29 | 5.2 | 16 | 4.3 | 64 | 0.2 |
| 81. Prefabr.buildings;sanitary,lighting etc.fixtrs | 4 | 0.0 | ||||||||
| 82. Furniture and parts thereof | 5 | 0.0 | 1 | 0.3 | 40 | 0.1 | ||||
| 84. Articles of apparel and clothing accessories | 1 | 0.1 | 1 | 0.0 | ||||||
| 85. Footwear | 1 | 0.2 | 2 | 0.0 | ||||||
| 87. Instruments and apparates n.e.s. | 2 | 0.0 | 6 | 0.8 | 28 | 5.0 | 18 | 0.1 | ||
| 88. Photographic equipment,optical goods etc. | 11 | 3.0 | ||||||||
| 89. Miscellaneous manufactured articles,n.e.s. | 1 | 0.0 | 1 | 0.1 | 2 | 0.6 | ||||
| 9. Goods not classified elsewhere | 1 | 0.2 | ||||||||
| 96. Coin (not gold coin or legal) | 1 | 0.2 | ||||||||
| All groups combined | 52,887 | 100.0 | 707 | 100.0 | 552 | 100.0 | 367 | 100.0 | 32,983 | 100.0 |

| 2021 | 2022 | 2023 | 2024 | 2025 | ||||||
|---|---|---|---|---|---|---|---|---|---|---|
| 1,000 € | % | 1,000 € | % | 1,000 € | % | 1,000 € | % | 1,000 € | % | |
| 7. Machinery,transport equipment | 9 | 94.1 | 1 | 66.8 | 11 | 77.0 | ||||
| 71. Power generating machinery and equipment | 5 | 48.6 | 1 | 28.6 | ||||||
| 74. General industrial machinery n.e.s. | 4 | 45.5 | 11 | 75.3 | ||||||
| 8. Miscellaneous manufactured articles | 2 | 16.1 | 1 | 64.0 | ||||||
| 89. Miscellaneous manufactured articles,n.e.s. | 2 | 16.1 | 1 | 51.2 | ||||||
| 9. Goods not classified elsewhere | 1 | 33.0 | 1 | 6.9 | 1 | 68.0 | ||||
| 93. Special transactions and commodities not classified | 1 | 33.0 | 1 | 6.9 | 1 | 68.0 | ||||
| All groups combined | 9 | 100.0 | 2 | 100.0 | 14 | 100.0 | 1 | 100.0 | 1 | 100.0 |
| Classification | Description | Year level | Quarter level | Month level | |
|---|---|---|---|---|---|
| SITC | Standard International Trade Classification (classification system is maintained by the United Nations) | ███ | ███ | ||
| BEC | The standard of statistical classification of BEC (Broad Economic Categories) is upheld by the UN and it is based on SITC-nomenclature. | ███ | ███ | ||
| NACE | National industrial classification based on Statistical Classification of Economic Activities in the European Community Nomenclature générale des Activités économiques dans les Communautés européennes | ███ | ███ | ||
| CPA | CPA = Classification of Products by Activities | ███ | ███ | ||
| CN | The Combined Nomenclature is the common nomenclature of the European Community. | ███ | ███ |