
| Export of goods from Finland and import to Finland | Trade Balance |
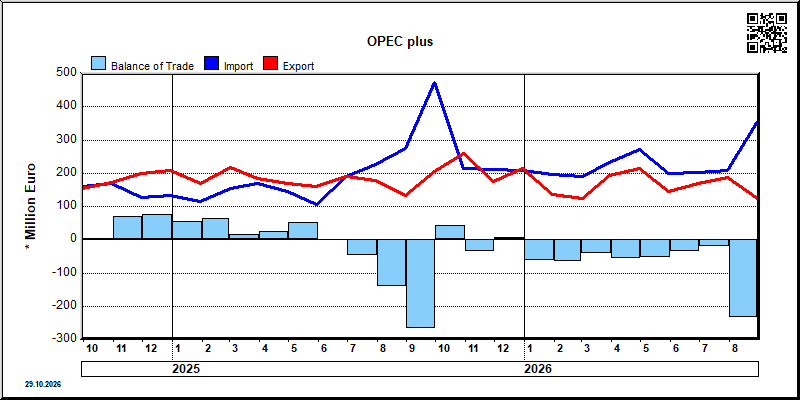
| Year | Month | Import 1,000 € | Export 1,000 € | Trade 1,000 € | Trade Balance 1,000 € |
|---|---|---|---|---|---|
| 2023 | 1 | 272,863 | 301,292 | 574,154 | 28,429 |
| 2023 | 2 | 197,938 | 188,581 | 386,520 | -9,357 |
| 2023 | 3 | 209,524 | 261,065 | 470,589 | 51,542 |
| 2023 | 4 | 167,604 | 175,244 | 342,848 | 7,639 |
| 2023 | 5 | 134,363 | 252,020 | 386,383 | 117,657 |
| 2023 | 6 | 163,592 | 231,604 | 395,196 | 68,013 |
| 2023 | 7 | 201,494 | 156,591 | 358,086 | -44,903 |
| 2023 | 8 | 211,040 | 228,141 | 439,181 | 17,101 |
| 2023 | 9 | 194,258 | 231,562 | 425,821 | 37,304 |
| 2023 | 10 | 195,598 | 162,824 | 358,422 | -32,774 |
| 2023 | 11 | 225,275 | 168,466 | 393,741 | -56,809 |
| 2023 | 12 | 176,537 | 284,452 | 460,990 | 107,915 |
| 2024 | 1 | 164,031 | 178,760 | 342,790 | 14,729 |
| 2024 | 2 | 164,880 | 184,764 | 349,644 | 19,884 |
| 2024 | 3 | 141,141 | 107,804 | 248,945 | -33,338 |
| 2024 | 4 | 210,487 | 233,649 | 444,135 | 23,162 |
| 2024 | 5 | 151,179 | 198,076 | 349,255 | 46,897 |
| 2024 | 6 | 154,971 | 179,190 | 334,161 | 24,219 |
| 2024 | 7 | 202,547 | 227,763 | 430,309 | 25,216 |
| 2024 | 8 | 197,123 | 181,988 | 379,111 | -15,135 |
| 2024 | 9 | 159,243 | 155,173 | 314,417 | -4,070 |
| 2024 | 10 | 168,310 | 173,276 | 341,586 | 4,966 |
| 2024 | 11 | 128,040 | 199,056 | 327,096 | 71,016 |
| 2024 | 12 | 132,391 | 209,195 | 341,586 | 76,805 |
| 2025 | 1 | 115,812 | 169,874 | 285,686 | 54,062 |
| 2025 | 2 | 152,654 | 215,806 | 368,459 | 63,152 |
| 2025 | 3 | 168,616 | 184,241 | 352,857 | 15,626 |
| 2025 | 4 | 145,734 | 170,188 | 315,922 | 24,453 |
| 2025 | 5 | 107,344 | 160,461 | 267,805 | 53,117 |
| 2025 | 6 | 191,202 | 190,452 | 381,654 | -749 |
| 2025 | 7 | 226,145 | 177,319 | 403,464 | -48,826 |
| 2025 | 8 | 273,675 | 133,484 | 407,159 | -140,191 |
| 2025 | 9 | 474,049 | 205,871 | 679,920 | -268,177 |
| 2025 | 10 | 215,761 | 259,791 | 475,552 | 44,029 |
| 2025 | 11 | 210,393 | 174,265 | 384,658 | -36,128 |
| 2025 | 12 | 207,780 | 214,917 | 422,697 | 7,137 |
| 2026 | 1 | 196,118 | 135,103 | 331,221 | -61,016 |
| 2026 | 2 | 190,141 | 124,372 | 314,513 | -65,769 |
| 2026 | 3 | 232,337 | 191,778 | 424,115 | -40,559 |
| 2026 | 4 | 272,909 | 215,625 | 488,534 | -57,285 |
| 2026 | 5 | 198,292 | 144,911 | 343,203 | -53,381 |
| 2026 | 6 | 204,092 | 167,800 | 371,892 | -36,291 |
| 2026 | 7 | 206,574 | 188,020 | 394,594 | -18,554 |
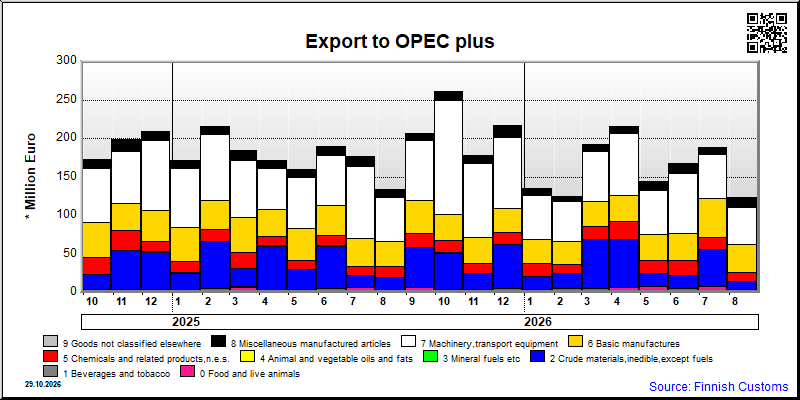
| 2026/3 | 2026/4 | 2026/5 | 2026/6 | 2026/7 | ||||||
|---|---|---|---|---|---|---|---|---|---|---|
| 1000 € | % | 1000 € | % | 1000 € | % | 1000 € | % | 1000 € | % | |
| 0. Food and live animals | 5,385 | 2.8 | 7,005 | 3.2 | 7,350 | 5.1 | 5,728 | 3.4 | 7,157 | 3.8 |
| 1. Beverages and tobacco | 68 | 0.0 | 96 | 0.0 | 106 | 0.1 | 87 | 0.1 | 184 | 0.1 |
| 2. Crude materials,inedible,except fuels | 63,749 | 33.2 | 61,774 | 28.6 | 17,146 | 11.8 | 15,672 | 9.3 | 48,299 | 25.7 |
| 3. Mineral fuels etc | 109 | 0.1 | 556 | 0.3 | 77 | 0.1 | 270 | 0.2 | 158 | 0.1 |
| 4. Animal and vegetable oils and fats | 119 | 0.1 | 2 | 0.0 | 135 | 0.1 | 50 | 0.0 | 47 | 0.0 |
| 5. Chemicals and related products,n.e.s. | 16,541 | 8.6 | 22,204 | 10.3 | 16,338 | 11.3 | 20,230 | 12.1 | 15,227 | 8.1 |
| 6. Basic manufactures | 32,313 | 16.8 | 34,015 | 15.8 | 34,177 | 23.6 | 34,329 | 20.5 | 51,271 | 27.3 |
| 7. Machinery,transport equipment | 64,201 | 33.5 | 81,419 | 37.8 | 58,013 | 40.0 | 77,981 | 46.5 | 56,849 | 30.2 |
| 8. Miscellaneous manufactured articles | 9,316 | 4.9 | 8,555 | 4.0 | 11,569 | 8.0 | 13,439 | 8.0 | 8,779 | 4.7 |
| 9. Goods not classified elsewhere | 13 | 0.0 | 50 | 0.0 | ||||||
| All groups combined | 191,778 | 100.0 | 215,625 | 100.0 | 144,911 | 100.0 | 167,800 | 100.0 | 188,020 | 100.0 |

| 2026/3 | 2026/4 | 2026/5 | 2026/6 | 2026/7 | ||||||
|---|---|---|---|---|---|---|---|---|---|---|
| 1000 € | % | 1000 € | % | 1000 € | % | 1000 € | % | 1000 € | % | |
| 0. Food and live animals | 7,481 | 3.2 | 6,678 | 2.4 | 6,943 | 3.5 | 4,422 | 2.2 | 3,045 | 1.5 |
| 1. Beverages and tobacco | 291 | 0.1 | 185 | 0.1 | 290 | 0.1 | 512 | 0.3 | 393 | 0.2 |
| 2. Crude materials,inedible,except fuels | 118,649 | 51.1 | 142,709 | 52.3 | 86,888 | 43.8 | 95,690 | 46.9 | 97,332 | 47.1 |
| 3. Mineral fuels etc | 2,733 | 1.2 | 14,228 | 5.2 | 91 | 0.0 | 2,064 | 1.0 | 77 | 0.0 |
| 4. Animal and vegetable oils and fats | 3,606 | 1.6 | 442 | 0.2 | 1,862 | 0.9 | 19 | 0.0 | 19 | 0.0 |
| 5. Chemicals and related products,n.e.s. | 25,780 | 11.1 | 17,511 | 6.4 | 16,185 | 8.2 | 20,987 | 10.3 | 27,645 | 13.4 |
| 6. Basic manufactures | 6,910 | 3.0 | 6,806 | 2.5 | 5,885 | 3.0 | 6,090 | 3.0 | 6,191 | 3.0 |
| 7. Machinery,transport equipment | 56,095 | 24.1 | 76,409 | 28.0 | 70,162 | 35.4 | 62,932 | 30.8 | 59,517 | 28.8 |
| 8. Miscellaneous manufactured articles | 10,760 | 4.6 | 7,943 | 2.9 | 9,945 | 5.0 | 11,333 | 5.6 | 12,328 | 6.0 |
| 9. Goods not classified elsewhere | 31 | 0.0 | 33 | 0.0 | 41 | 0.0 | 44 | 0.0 | 28 | 0.0 |
| All groups combined | 232,337 | 100.0 | 272,909 | 100.0 | 198,292 | 100.0 | 204,092 | 100.0 | 206,574 | 100.0 |
| Classification | Description | Year level | Quarter level | Month level | Year 2026 sofar |
|---|---|---|---|---|---|
| SITC | Standard International Trade Classification (classification system is maintained by the United Nations) | ███ | ███ | ███ | ███ |
| BEC | The standard of statistical classification of BEC (Broad Economic Categories) is upheld by the UN and it is based on SITC-nomenclature. | ███ | ███ | ███ | ███ |
| NACE | National industrial classification based on Statistical Classification of Economic Activities in the European Community Nomenclature générale des Activités économiques dans les Communautés européennes | ███ | ███ | ███ | ███ |
| CPA | CPA = Classification of Products by Activities | ███ | ███ | ███ | ███ |
| CN | The Combined Nomenclature is the common nomenclature of the European Community. | ███ | ███ | ███ | ███ |