
| Export of goods from Finland and import to Finland | Trade Balance |

| Import 1,000 € | Export 1,000 € | Trade 1,000 € | Trade Balance 1,000 € | |
|---|---|---|---|---|
| 2019 Q1 | 7,950,482 | 8,083,113 | 16,033,594 | 132,631 |
| 2019 Q2 | 8,376,910 | 7,950,456 | 16,327,366 | -426,454 |
| 2019 Q3 | 7,948,429 | 7,457,624 | 15,406,054 | -490,805 |
| 2019 Q4 | 7,821,307 | 8,391,505 | 16,212,812 | 570,197 |
| 2020 Q1 | 7,513,958 | 6,912,982 | 14,426,940 | -600,976 |
| 2020 Q2 | 5,777,055 | 5,973,671 | 11,750,726 | 196,616 |
| 2020 Q3 | 6,827,630 | 6,861,433 | 13,689,062 | 33,803 |
| 2020 Q4 | 6,883,413 | 8,519,647 | 15,403,060 | 1,636,233 |
| 2021 Q1 | 7,226,877 | 7,370,722 | 14,597,599 | 143,845 |
| 2021 Q2 | 7,465,726 | 7,869,172 | 15,334,898 | 403,447 |
| 2021 Q3 | 7,975,503 | 8,061,458 | 16,036,961 | 85,955 |
| 2021 Q4 | 9,584,958 | 10,217,887 | 19,802,845 | 632,930 |
| 2022 Q1 | 9,651,222 | 8,705,809 | 18,357,031 | -945,412 |
| 2022 Q2 | 9,046,528 | 9,854,468 | 18,900,997 | 807,940 |
| 2022 Q3 | 8,491,588 | 9,287,073 | 17,778,661 | 795,485 |
| 2022 Q4 | 8,808,051 | 10,314,715 | 19,122,766 | 1,506,665 |
| 2023 Q1 | 7,380,794 | 8,309,435 | 15,690,229 | 928,641 |
| 2023 Q2 | 7,596,385 | 8,414,500 | 16,010,884 | 818,115 |
| 2023 Q3 | 6,801,652 | 7,861,446 | 14,663,098 | 1,059,794 |
| 2023 Q4 | 6,926,419 | 9,850,313 | 16,776,732 | 2,923,894 |
| 2024 Q1 | 6,757,108 | 6,747,740 | 13,504,848 | -9,369 |
| 2024 Q2 | 6,872,601 | 8,867,290 | 15,739,891 | 1,994,689 |
| 2024 Q3 | 7,083,640 | 8,154,679 | 15,238,319 | 1,071,039 |
| 2024 Q4 | 6,899,623 | 7,481,420 | 14,381,043 | 581,796 |
| 2025 Q1 | 6,604,079 | 7,310,431 | 13,914,510 | 706,352 |
| 2025 Q2 | 6,694,433 | 7,801,089 | 14,495,522 | 1,106,656 |
| 2025 Q3 | 7,202,407 | 8,912,630 | 16,115,037 | 1,710,223 |
| 2025 Q4 | 6,991,051 | 8,303,248 | 15,294,299 | 1,312,197 |
| 2026 Q1 | 7,443,644 | 8,268,015 | 15,711,659 | 824,372 |
| 2026 Q2 | 7,717,446 | 10,825,491 | 18,542,937 | 3,108,046 |

| Q2 / 2026 | Q2 / 2025 | Muutos edellisestä vastaavasta kaudesta % | ||
|---|---|---|---|---|
| 1,000 € | % | 1,000 € | ||
| 0. Food and live animals | 110,899 | 1.0 | 115,305 | -3.8 |
| 1. Beverages and tobacco | 6,032 | 0.1 | 6,438 | -6.3 |
| 2. Crude materials,inedible,except fuels | 686,906 | 6.3 | 682,134 | 0.7 |
| 3. Mineral fuels etc | 330,652 | 3.1 | 194,284 | 70.2 |
| 4. Animal and vegetable oils and fats | 3,553 | 0.0 | 2,139 | 66.1 |
| 5. Chemicals and related products,n.e.s. | 1,398,059 | 12.9 | 774,094 | 80.6 |
| 6. Basic manufactures | 2,389,283 | 22.1 | 2,034,619 | 17.4 |
| 7. Machinery,transport equipment | 4,506,769 | 41.6 | 2,750,215 | 63.9 |
| 8. Miscellaneous manufactured articles | 704,177 | 6.5 | 809,553 | -13.0 |
| 9. Goods not classified elsewhere | 689,161 | 6.4 | 406,706 | 69.4 |
| All groups combined | 10,825,491 | 100.0 | 7,775,487 | 39.2 |
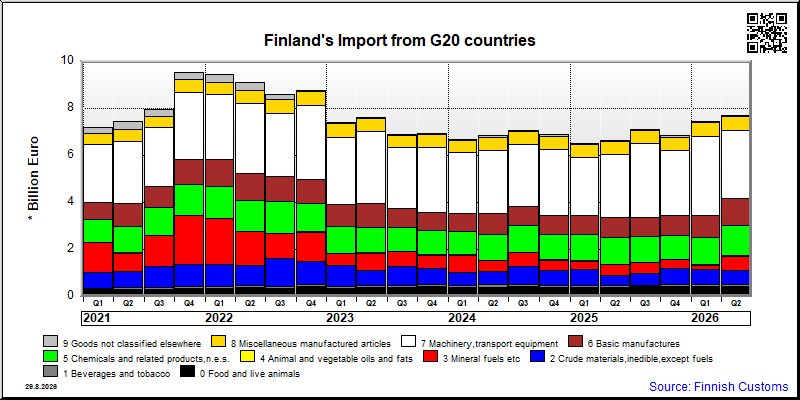
| Q2 / 2026 | Q2 / 2025 | Muutos edellisestä vastaavasta kaudesta % | ||
|---|---|---|---|---|
| 1,000 € | % | 1,000 € | ||
| 0. Food and live animals | 406,706 | 5.3 | 399,154 | 1.9 |
| 1. Beverages and tobacco | 85,260 | 1.1 | 87,824 | -2.9 |
| 2. Crude materials,inedible,except fuels | 594,844 | 7.7 | 412,773 | 44.1 |
| 3. Mineral fuels etc | 633,732 | 8.2 | 441,664 | 43.5 |
| 4. Animal and vegetable oils and fats | 10,773 | 0.1 | 15,709 | -31.4 |
| 5. Chemicals and related products,n.e.s. | 1,296,041 | 16.8 | 1,154,537 | 12.3 |
| 6. Basic manufactures | 1,143,594 | 14.8 | 862,311 | 32.6 |
| 7. Machinery,transport equipment | 2,900,176 | 37.6 | 2,654,366 | 9.3 |
| 8. Miscellaneous manufactured articles | 592,401 | 7.7 | 551,362 | 7.4 |
| 9. Goods not classified elsewhere | 53,919 | 0.7 | 68,452 | -21.2 |
| All groups combined | 7,717,446 | 100.0 | 6,648,152 | 16.1 |
| Classification | Description | Year level | Quarter level | Month level | Year 2026 sofar |
|---|---|---|---|---|---|
| SITC | Standard International Trade Classification (classification system is maintained by the United Nations) | ███ | ███ | ███ | ███ |
| BEC | The standard of statistical classification of BEC (Broad Economic Categories) is upheld by the UN and it is based on SITC-nomenclature. | ███ | ███ | ███ | ███ |
| NACE | National industrial classification based on Statistical Classification of Economic Activities in the European Community Nomenclature générale des Activités économiques dans les Communautés européennes | ███ | ███ | ███ | ███ |
| CPA | CPA = Classification of Products by Activities | ███ | ███ | ███ | ███ |
| CN | The Combined Nomenclature is the common nomenclature of the European Community. | ███ | ███ | ███ | ███ |