
| Export of goods from Finland and import to Finland | BEC (Broad Economic Categories) |
*) The standard of statistical classification of BEC (Broad Economic Categories) is upheld by the UN and it is based on SITC-nomenclature.

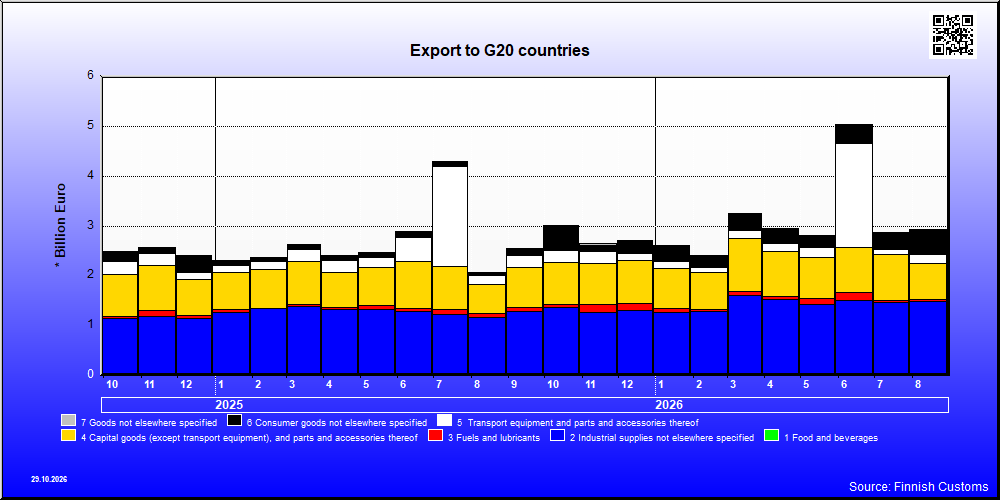
| 8 / 2026 | 8 / 2025 | Change from previous year's equal month % | ||
|---|---|---|---|---|
| 1,000 € | % | 1000 € | ||
| 1. Food and beverages | 28,827 | 1.0 | 36,306 | -20.6 |
| 11. Food and beverages, primary | 6,442 | 0.2 | 8,903 | -27.6 |
| 111. Food and beverages, primary, mainly for industry | 173 | 0.0 | 2,154 | -92.0 |
| 112. Food and beverages, primary, mainly for household consumption | 6,268 | 0.2 | 6,748 | -7.1 |
| 12. Food and beverages, processed | 22,385 | 0.8 | 27,403 | -18.3 |
| 121. Food and beverages, processed, mainly for industry | 4,972 | 0.2 | 6,003 | -17.2 |
| 122. Food and beverages, processed, mainly for household consumption | 17,413 | 0.6 | 21,400 | -18.6 |
| 2. Industrial supplies not elsewhere specified | 1,454,347 | 49.7 | 1,127,328 | 29.0 |
| 21. Industrial supplies not elsewhere specified, primary | 101,670 | 3.5 | 103,648 | -1.9 |
| 22. Industrial supplies not elsewhere specified, processed | 1,352,676 | 46.2 | 1,023,681 | 32.1 |
| 3. Fuels and lubricants | 49,916 | 1.7 | 87,814 | -43.2 |
| 31. Fuels and lubricants, primary | 1,447 | 0.0 | 894 | 62.0 |
| 32. Fuels and lubricants, processed | 48,468 | 1.7 | 86,920 | -44.2 |
| 321. Fuels and lubricants, motor spirit | 35,665 | 1.2 | 80,243 | -55.6 |
| 322. Fuels and lubricants, other | 12,803 | 0.4 | 6,677 | 91.7 |
| 4. Capital goods (except transport equipment), and parts and accessories thereof | 710,533 | 24.3 | 571,478 | 24.3 |
| 41. Capital goods (except transport equipment) | 511,536 | 17.5 | 411,348 | 24.4 |
| 42. Capital goods (except transport equipment), parts and accessories | 198,996 | 6.8 | 160,130 | 24.3 |
| 5. Transport equipment and parts and accessories thereof | 175,043 | 6.0 | 186,589 | -6.2 |
| 51. Passenger motor vehicles | 391 | 0.0 | 83,751 | -99.5 |
| 52. Transport equipment, other than passenger motor vehicles | 110,824 | 3.8 | 34,467 | 221.5 |
| 521. Transport equipment, other than passenger motor vehicles, industrial | 106,866 | 3.7 | 29,332 | 264.3 |
| 522. Transport equipment, other than passenger motor vehicles, non-industrial | 3,958 | 0.1 | 5,135 | -22.9 |
| 53. Transport equipment, parts and accessories | 63,828 | 2.2 | 68,371 | -6.6 |
| 6. Consumer goods not elsewhere specified | 495,370 | 16.9 | 54,591 | 807.4 |
| 61. Consumer goods not elsewhere specified, durable | 13,219 | 0.5 | 9,312 | 42.0 |
| 62. Consumer goods not elsewhere specified, semi-durable | 30,765 | 1.1 | 26,825 | 14.7 |
| 63. Consumer goods not elsewhere specified, non-durable | 451,386 | 15.4 | 18,455 | .. |
| 7. Goods not elsewhere specified | 10,824 | 0.4 | 8,868 | 22.1 |
| All groups | 2,924,860 | 100.0 | 2,072,975 | 41.1 |

| 8 / 2026 | 8 / 2025 | Change from previous year's equal month % | ||
|---|---|---|---|---|
| 1,000 € | % | 1,000 € | ||
| 1. Food and beverages | 142,712 | 5.0 | 146,816 | -2.8 |
| 11. Food and beverages, primary | 32,699 | 1.1 | 27,408 | 19.3 |
| 111. Food and beverages, primary, mainly for industry | 14,923 | 0.5 | 10,373 | 43.9 |
| 112. Food and beverages, primary, mainly for household consumption | 17,776 | 0.6 | 17,035 | 4.4 |
| 12. Food and beverages, processed | 110,013 | 3.8 | 119,408 | -7.9 |
| 121. Food and beverages, processed, mainly for industry | 7,424 | 0.3 | 9,861 | -24.7 |
| 122. Food and beverages, processed, mainly for household consumption | 102,588 | 3.6 | 109,548 | -6.4 |
| 2. Industrial supplies not elsewhere specified | 1,019,184 | 35.6 | 695,385 | 46.6 |
| 21. Industrial supplies not elsewhere specified, primary | 294,909 | 10.3 | 101,525 | 190.5 |
| 22. Industrial supplies not elsewhere specified, processed | 724,275 | 25.3 | 593,860 | 22.0 |
| 3. Fuels and lubricants | 163,303 | 5.7 | 44,502 | 267.0 |
| 31. Fuels and lubricants, primary | 34,237 | 1.2 | 17,484 | 95.8 |
| 32. Fuels and lubricants, processed | 129,066 | 4.5 | 27,018 | 377.7 |
| 321. Fuels and lubricants, motor spirit | 4 | 0.0 | 115 | -96.2 |
| 322. Fuels and lubricants, other | 129,062 | 4.5 | 26,903 | 379.7 |
| 4. Capital goods (except transport equipment), and parts and accessories thereof | 815,994 | 28.5 | 633,232 | 28.9 |
| 41. Capital goods (except transport equipment) | 592,087 | 20.7 | 439,945 | 34.6 |
| 42. Capital goods (except transport equipment), parts and accessories | 223,907 | 7.8 | 193,286 | 15.8 |
| 5. Transport equipment and parts and accessories thereof | 479,254 | 16.8 | 354,998 | 35.0 |
| 51. Passenger motor vehicles | 137,001 | 4.8 | 138,056 | -0.8 |
| 52. Transport equipment, other than passenger motor vehicles | 193,159 | 6.8 | 57,328 | 236.9 |
| 521. Transport equipment, other than passenger motor vehicles, industrial | 187,142 | 6.5 | 51,363 | 264.4 |
| 522. Transport equipment, other than passenger motor vehicles, non-industrial | 6,017 | 0.2 | 5,965 | 0.9 |
| 53. Transport equipment, parts and accessories | 149,094 | 5.2 | 159,614 | -6.6 |
| 6. Consumer goods not elsewhere specified | 209,607 | 7.3 | 201,526 | 4.0 |
| 61. Consumer goods not elsewhere specified, durable | 36,019 | 1.3 | 35,482 | 1.5 |
| 62. Consumer goods not elsewhere specified, semi-durable | 53,633 | 1.9 | 52,642 | 1.9 |
| 63. Consumer goods not elsewhere specified, non-durable | 119,955 | 4.2 | 113,402 | 5.8 |
| 7. Goods not elsewhere specified | 30,384 | 1.1 | 28,017 | 8.4 |
| All groups | 2,860,437 | 100.0 | 2,104,477 | 35.9 |
| Classification | Description | Year level | Quarter level | Month level | Year 2026 sofar |
|---|---|---|---|---|---|
| SITC | Standard International Trade Classification (classification system is maintained by the United Nations) | ███ | ███ | ███ | ███ |
| BEC | The standard of statistical classification of BEC (Broad Economic Categories) is upheld by the UN and it is based on SITC-nomenclature. | ███ | ███ | ███ | ███ |
| NACE | National industrial classification based on Statistical Classification of Economic Activities in the European Community Nomenclature générale des Activités économiques dans les Communautés européennes | ███ | ███ | ███ | ███ |
| CPA | CPA = Classification of Products by Activities | ███ | ███ | ███ | ███ |
| CN | The Combined Nomenclature is the common nomenclature of the European Community. | ███ | ███ | ███ | ███ |