
| Export of goods from Finland and import to Finland | BEC (Broad Economic Categories) |
*) The standard of statistical classification of BEC (Broad Economic Categories) is upheld by the UN and it is based on SITC-nomenclature.
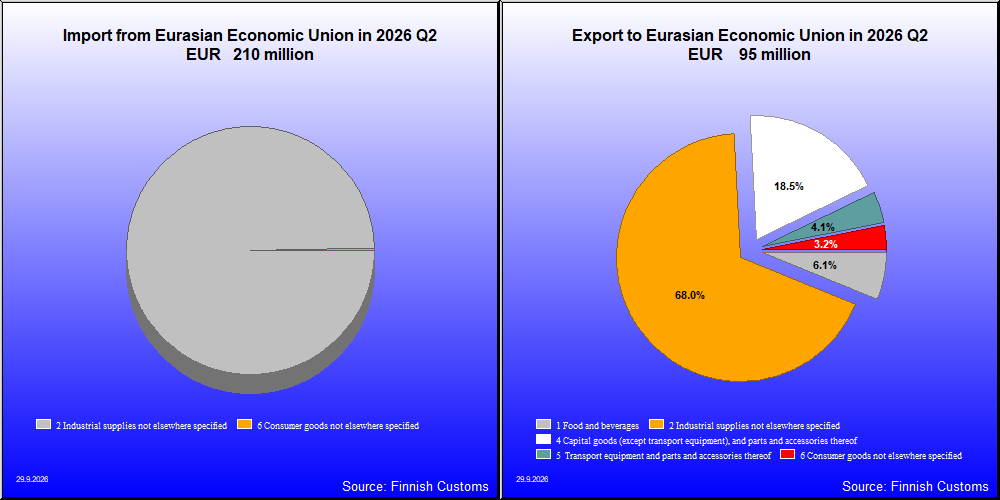

| Q2 / 2026 | Q2 / 2025 | Muutos edellisestä vastaavasta kaudesta % | ||
|---|---|---|---|---|
| 1,000 € | % | 1,000 € | ||
| 1. Food and beverages | 5,810 | 6.1 | 5,866 | -0.9 |
| 11. Food and beverages, primary | 15 | 0.0 | 124 | -87.8 |
| 111. Food and beverages, primary, mainly for industry | 0 | 0.0 | 0 | 733.3 |
| 112. Food and beverages, primary, mainly for household consumption | 15 | 0.0 | 124 | -87.9 |
| 12. Food and beverages, processed | 5,795 | 6.1 | 5,741 | 0.9 |
| 121. Food and beverages, processed, mainly for industry | 234 | 0.2 | 83 | 182.6 |
| 122. Food and beverages, processed, mainly for household consumption | 5,561 | 5.9 | 5,658 | -1.7 |
| 2. Industrial supplies not elsewhere specified | 64,463 | 68.0 | 92,716 | -30.5 |
| 21. Industrial supplies not elsewhere specified, primary | 40 | 0.0 | 205 | -80.5 |
| 22. Industrial supplies not elsewhere specified, processed | 64,423 | 67.9 | 92,510 | -30.4 |
| 3. Fuels and lubricants | 13 | 0.0 | 28 | -54.5 |
| 32. Fuels and lubricants, processed | 13 | 0.0 | 28 | -54.5 |
| 322. Fuels and lubricants, other | 13 | 0.0 | 28 | -54.5 |
| 4. Capital goods (except transport equipment), and parts and accessories thereof | 17,624 | 18.6 | 23,529 | -25.1 |
| 41. Capital goods (except transport equipment) | 13,211 | 13.9 | 18,122 | -27.1 |
| 42. Capital goods (except transport equipment), parts and accessories | 4,412 | 4.7 | 5,406 | -18.4 |
| 5. Transport equipment and parts and accessories thereof | 3,918 | 4.1 | 1,767 | 121.7 |
| 51. Passenger motor vehicles | 31 | 0.0 | 144 | -78.4 |
| 52. Transport equipment, other than passenger motor vehicles | 3,142 | 3.3 | 1,253 | 150.6 |
| 521. Transport equipment, other than passenger motor vehicles, industrial | 2,915 | 3.1 | 774 | 276.6 |
| 522. Transport equipment, other than passenger motor vehicles, non-industrial | 226 | 0.2 | 479 | -52.8 |
| 53. Transport equipment, parts and accessories | 745 | 0.8 | 370 | 101.5 |
| 6. Consumer goods not elsewhere specified | 3,002 | 3.2 | 7,031 | -57.3 |
| 61. Consumer goods not elsewhere specified, durable | 666 | 0.7 | 1,086 | -38.7 |
| 62. Consumer goods not elsewhere specified, semi-durable | 1,385 | 1.5 | 2,878 | -51.9 |
| 63. Consumer goods not elsewhere specified, non-durable | 951 | 1.0 | 3,067 | -69.0 |
| All groups | 94,831 | 100.0 | 130,936 | -27.6 |

| Q2 / 2026 | Q2 / 2025 | Muutos edellisestä vastaavasta kaudesta % | ||
|---|---|---|---|---|
| 1,000 € | % | 1,000 € | ||
| 1. Food and beverages | 347 | 0.2 | 615 | -43.6 |
| 11. Food and beverages, primary | 216 | 0.1 | 27 | 701.7 |
| 111. Food and beverages, primary, mainly for industry | 103 | 0.0 | 19 | 453.3 |
| 112. Food and beverages, primary, mainly for household consumption | 113 | 0.1 | 8 | .. |
| 12. Food and beverages, processed | 132 | 0.1 | 588 | -77.6 |
| 121. Food and beverages, processed, mainly for industry | 0 | 0.0 | 72 | -99.7 |
| 122. Food and beverages, processed, mainly for household consumption | 131 | 0.1 | 517 | -74.6 |
| 2. Industrial supplies not elsewhere specified | 208,423 | 99.0 | 154,064 | 35.3 |
| 21. Industrial supplies not elsewhere specified, primary | 31,335 | 14.9 | 3,402 | 821.2 |
| 22. Industrial supplies not elsewhere specified, processed | 177,088 | 84.1 | 150,663 | 17.5 |
| 3. Fuels and lubricants | 31 | 0.0 | 0 | .. |
| 32. Fuels and lubricants, processed | 31 | 0.0 | 0 | .. |
| 322. Fuels and lubricants, other | 31 | 0.0 | 0 | .. |
| 4. Capital goods (except transport equipment), and parts and accessories thereof | 630 | 0.3 | 190 | 231.2 |
| 41. Capital goods (except transport equipment) | 14 | 0.0 | 21 | -32.6 |
| 42. Capital goods (except transport equipment), parts and accessories | 616 | 0.3 | 169 | 264.2 |
| 5. Transport equipment and parts and accessories thereof | 239 | 0.1 | 672 | -64.5 |
| 51. Passenger motor vehicles | 0 | 0 | 405 | .. |
| 52. Transport equipment, other than passenger motor vehicles | 0 | 0.0 | 0 | 409.5 |
| 521. Transport equipment, other than passenger motor vehicles, industrial | 0 | 0 | 0 | .. |
| 522. Transport equipment, other than passenger motor vehicles, non-industrial | 0 | 0.0 | 0 | .. |
| 53. Transport equipment, parts and accessories | 239 | 0.1 | 268 | -10.9 |
| 6. Consumer goods not elsewhere specified | 826 | 0.4 | 385 | 114.2 |
| 61. Consumer goods not elsewhere specified, durable | 3 | 0.0 | 6 | -49.3 |
| 62. Consumer goods not elsewhere specified, semi-durable | 406 | 0.2 | 242 | 67.6 |
| 63. Consumer goods not elsewhere specified, non-durable | 417 | 0.2 | 138 | 202.9 |
| 7. Goods not elsewhere specified | 25 | 0.0 | 7 | 263.7 |
| All groups | 210,521 | 100.0 | 155,935 | 35.0 |
| Classification | Description | Year level | Quarter level | Month level | Year 2026 sofar |
|---|---|---|---|---|---|
| SITC | Standard International Trade Classification (classification system is maintained by the United Nations) | ███ | ███ | ███ | ███ |
| BEC | The standard of statistical classification of BEC (Broad Economic Categories) is upheld by the UN and it is based on SITC-nomenclature. | ███ | ███ | ███ | ███ |
| NACE | National industrial classification based on Statistical Classification of Economic Activities in the European Community Nomenclature générale des Activités économiques dans les Communautés européennes | ███ | ███ | ███ | ███ |
| CPA | CPA = Classification of Products by Activities | ███ | ███ | ███ | ███ |
| CN | The Combined Nomenclature is the common nomenclature of the European Community. | ███ | ███ | ███ | ███ |