
| Export of goods from Finland and import to Finland | BEC (Broad Economic Categories) |
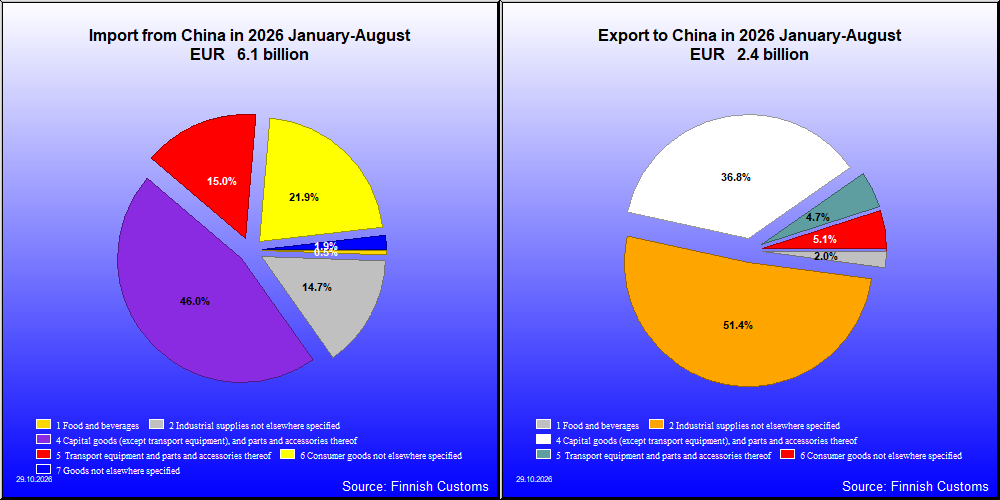
| 2026 1-8 1,000 € | 2025 1-8 1,000 € | Change % |
|
|---|---|---|---|
| 1. Food and beverages | 32,031 | 23,307 | 37.4 |
| 11. Food and beverages, primary | 8,512 | 6,629 | 28.4 |
| 111. Food and beverages, primary, mainly for industry | 1,469 | 260 | 464.3 |
| 112. Food and beverages, primary, mainly for household consumption | 7,044 | 6,369 | 10.6 |
| 12. Food and beverages, processed | 23,518 | 16,678 | 41.0 |
| 121. Food and beverages, processed, mainly for industry | 651 | 205 | 216.9 |
| 122. Food and beverages, processed, mainly for household consumption | 22,868 | 16,473 | 38.8 |
| 2. Industrial supplies not elsewhere specified | 890,874 | 632,338 | 40.9 |
| 21. Industrial supplies not elsewhere specified, primary | 19,421 | 13,819 | 40.5 |
| 22. Industrial supplies not elsewhere specified, processed | 871,453 | 618,518 | 40.9 |
| 3. Fuels and lubricants | 1,002 | 877 | 14.2 |
| 31. Fuels and lubricants, primary | 0 | 0 | -58.4 |
| 32. Fuels and lubricants, processed | 1,002 | 877 | 14.2 |
| 321. Fuels and lubricants, motor spirit | 0 | 0 | .. |
| 322. Fuels and lubricants, other | 1,002 | 877 | 14.2 |
| 4. Capital goods (except transport equipment), and parts and accessories thereof | 2,780,902 | 2,007,044 | 38.6 |
| 41. Capital goods (except transport equipment) | 2,002,900 | 1,507,585 | 32.9 |
| 42. Capital goods (except transport equipment), parts and accessories | 778,003 | 499,459 | 55.8 |
| 5. Transport equipment and parts and accessories thereof | 909,101 | 759,388 | 19.7 |
| 51. Passenger motor vehicles | 152,154 | 115,498 | 31.7 |
| 52. Transport equipment, other than passenger motor vehicles | 106,004 | 90,328 | 17.4 |
| 521. Transport equipment, other than passenger motor vehicles, industrial | 78,052 | 56,793 | 37.4 |
| 522. Transport equipment, other than passenger motor vehicles, non-industrial | 27,952 | 33,535 | -16.6 |
| 53. Transport equipment, parts and accessories | 650,943 | 553,561 | 17.6 |
| 6. Consumer goods not elsewhere specified | 1,324,009 | 1,012,160 | 30.8 |
| 61. Consumer goods not elsewhere specified, durable | 357,156 | 270,840 | 31.9 |
| 62. Consumer goods not elsewhere specified, semi-durable | 787,306 | 601,967 | 30.8 |
| 63. Consumer goods not elsewhere specified, non-durable | 179,547 | 139,353 | 28.8 |
| 7. Goods not elsewhere specified | 114,938 | 147,331 | -22.0 |
| All groups | 6,052,857 | 4,582,446 | 32.1 |
| Classification | Description | Year level | Quarter level | Month level | Year 2026 sofar |
|---|---|---|---|---|---|
| SITC | Standard International Trade Classification (classification system is maintained by the United Nations) | ███ | ███ | ███ | ███ |
| BEC | The standard of statistical classification of BEC (Broad Economic Categories) is upheld by the UN and it is based on SITC-nomenclature. | ███ | ███ | ███ | ███ |
| NACE | National industrial classification based on Statistical Classification of Economic Activities in the European Community Nomenclature générale des Activités économiques dans les Communautés européennes | ███ | ███ | ███ | ███ |
| CPA | CPA = Classification of Products by Activities | ███ | ███ | ███ | ███ |
| CN | The Combined Nomenclature is the common nomenclature of the European Community. | ███ | ███ | ███ | ███ |