
| Export of goods from Finland and import to Finland | Trade Balance |

| Year | Import 1,000 € | Export 1,000 € | Trade 1,000 € | Trade balance 1,000 € |
|---|---|---|---|---|
| 2002 | 6 | 2,361 | 2,367 | 2,355 |
| 2003 | 1 | 523 | 524 | 523 |
| 2004 | 2 | 6,583 | 6,585 | 6,581 |
| 2005 | 21 | 1,041 | 1,062 | 1,019 |
| 2006 | 4 | 2,078 | 2,082 | 2,074 |
| 2007 | 13 | 1,282 | 1,296 | 1,269 |
| 2008 | 5 | 3,992 | 3,996 | 3,987 |
| 2009 | 169 | 16,077 | 16,246 | 15,907 |
| 2010 | 5 | 4,488 | 4,493 | 4,483 |
| 2011 | 134 | 2,830 | 2,964 | 2,696 |
| 2012 | 515 | 22,484 | 23,000 | 21,969 |
| 2013 | 227 | 1,720 | 1,946 | 1,493 |
| 2014 | 73 | 4,412 | 4,485 | 4,339 |
| 2015 | 99 | 4,919 | 5,018 | 4,821 |
| 2016 | 76 | 6,650 | 6,726 | 6,574 |
| 2017 | 184 | 10,021 | 10,205 | 9,837 |
| 2018 | 111 | 8,725 | 8,836 | 8,614 |
| 2019 | 85 | 16,364 | 16,449 | 16,279 |
| 2020 | 234 | 10,856 | 11,089 | 10,622 |
| 2021 | 340 | 5,606 | 5,946 | 5,267 |
| 2022 | 252 | 3,047 | 3,299 | 2,795 |
| 2023 | 261 | 4,229 | 4,490 | 3,967 |
| 2024 | 450 | 17,010 | 17,461 | 16,560 |
| 2025 | 748 | 16,119 | 16,867 | 15,371 |
*) SITC = Standard International Trade Classification (classification system is maintained by the United Nations)
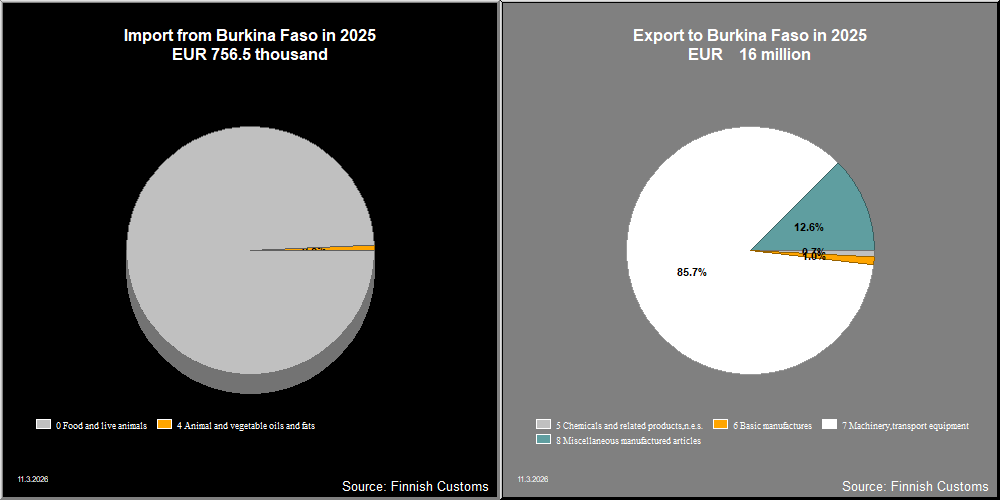

| 2021 | 2022 | 2023 | 2024 | 2025 | ||||||
|---|---|---|---|---|---|---|---|---|---|---|
| 1,000 € | % | 1,000 € | % | 1,000 € | % | 1,000 € | % | 1,000 € | % | |
| 5. Chemicals and related products,n.e.s. | 4,446 | 81.0 | 1,239 | 40.7 | 918 | 21.7 | 1,751 | 10.3 | 118 | 0.7 |
| 52. Inorganic chemicals | 1 | 0.0 | 1 | 0.0 | 1 | 0.0 | 1 | 0.0 | ||
| 54. Medicinal and pharmaceutical products | 4,348 | 79.2 | 1,128 | 37.0 | 742 | 17.5 | 1,711 | 10.1 | ||
| 55. Perfume,cleaning etc.preparations | 1 | 0.0 | 1 | 0.0 | 1 | 0.0 | 1 | 0.0 | 1 | 0.0 |
| 57. Plastics in primary forms | 50 | 1.2 | ||||||||
| 58. Plastics in non-primary forms | 1 | 0.0 | ||||||||
| 59. Chemical materials and products,n.e.s. | 96 | 1.8 | 108 | 3.5 | 124 | 2.9 | 39 | 0.2 | 116 | 0.7 |
| 6. Basic manufactures | 71 | 1.3 | 162 | 5.3 | 121 | 2.9 | 127 | 0.7 | 165 | 1.0 |
| 62. Rubber manufactures,n.e.s. | 19 | 0.3 | 16 | 0.5 | 30 | 0.7 | 14 | 0.1 | 26 | 0.2 |
| 64. Paper,paperboard and articles thereof | 42 | 0.8 | 49 | 1.6 | 34 | 0.8 | 19 | 0.1 | 86 | 0.5 |
| 65. Textile yarn,fabrics,made up articles,etc. | 29 | 0.7 | ||||||||
| 66. Non-metallic mineral manufactures,n.e.s. | 13 | 0.3 | ||||||||
| 67. Iron and steel | 2 | 0.0 | 1 | 0.0 | 1 | 0.0 | 48 | 0.3 | 1 | 0.0 |
| 69. Manufactures of metals,n.e.s. | 8 | 0.1 | 97 | 3.2 | 13 | 0.3 | 47 | 0.3 | 53 | 0.3 |
| 7. Machinery,transport equipment | 817 | 14.9 | 1,533 | 50.3 | 3,037 | 71.8 | 14,932 | 87.8 | 13,800 | 85.7 |
| 71. Power generating machinery and equipment | 152 | 2.8 | 25 | 0.8 | 7 | 0.2 | 80 | 0.5 | 548 | 3.4 |
| 72. Machinery for specialized industries | 249 | 4.5 | 1,115 | 36.6 | 2,252 | 53.2 | 8,681 | 51.0 | 7,061 | 43.8 |
| 73. Metal working machinery | 10 | 0.1 | ||||||||
| 74. General industrial machinery n.e.s. | 289 | 5.3 | 230 | 7.6 | 337 | 8.0 | 140 | 0.8 | 3,145 | 19.5 |
| 75. Office machines and adp machines | 1 | 0.0 | 41 | 0.2 | ||||||
| 76. Telecommunications and sound recording equipment | 5 | 0.1 | 13 | 0.4 | 65 | 1.5 | 71 | 0.4 | 126 | 0.8 |
| 77. Electric machinery,n.e.s.and parts | 123 | 2.2 | 87 | 2.9 | 347 | 8.2 | 601 | 3.5 | 109 | 0.7 |
| 78. Road vehicles | 62 | 2.0 | 28 | 0.7 | 5,319 | 31.3 | 2,800 | 17.4 | ||
| 8. Miscellaneous manufactured articles | 154 | 2.8 | 113 | 3.7 | 153 | 3.6 | 203 | 1.2 | 2,022 | 12.6 |
| 82. Furniture and parts thereof | 2 | 0.1 | ||||||||
| 83. Travel goods,handbags and sim.containers | 2 | 0.0 | ||||||||
| 84. Articles of apparel and clothing accessories | 1 | 0.0 | 26 | 0.6 | ||||||
| 87. Instruments and apparates n.e.s. | 141 | 2.6 | 104 | 3.4 | 103 | 2.4 | 199 | 1.2 | 2,010 | 12.5 |
| 89. Miscellaneous manufactured articles,n.e.s. | 12 | 0.2 | 7 | 0.2 | 22 | 0.5 | 4 | 0.0 | 12 | 0.1 |
| All groups combined | 5,487 | 100.0 | 3,047 | 100.0 | 4,229 | 100.0 | 17,013 | 100.0 | 16,106 | 100.0 |
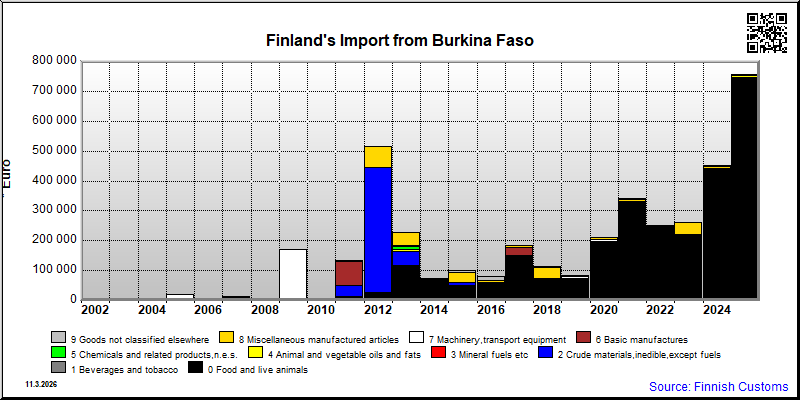
| 2021 | 2022 | 2023 | 2024 | 2025 | ||||||
|---|---|---|---|---|---|---|---|---|---|---|
| 1,000 € | % | 1,000 € | % | 1,000 € | % | 1,000 € | % | 1,000 € | % | |
| 0. Food and live animals | 328 | 96.6 | 249 | 99.0 | 220 | 84.3 | 440 | 97.7 | 747 | 98.8 |
| 04. Cereals and cereal preparations | 5 | 1.5 | ||||||||
| 05. Vegetables and fruit | 323 | 95.1 | 248 | 98.4 | 220 | 84.3 | 440 | 97.7 | 742 | 98.1 |
| 07. Coffee,tea,cocoa,spices | 1 | 0.5 | 5 | 0.7 | ||||||
| 2. Crude materials,inedible,except fuels | 2 | 0.6 | ||||||||
| 22. Oil seeds,oleaginous fruits | 2 | 0.6 | ||||||||
| 4. Animal and vegetable oils and fats | 6 | 0.8 | ||||||||
| 42. Fixed vegetable fats and oils | 6 | 0.8 | ||||||||
| 6. Basic manufactures | 1 | 0.4 | ||||||||
| 63. Wood and cork manufactures | 1 | 0.4 | ||||||||
| 7. Machinery,transport equipment | 3 | 0.9 | 1 | 0.3 | 1 | 0.1 | ||||
| 74. General industrial machinery n.e.s. | 1 | 0.2 | ||||||||
| 75. Office machines and adp machines | 1 | 0.1 | ||||||||
| 77. Electric machinery,n.e.s.and parts | 3 | 0.9 | ||||||||
| 8. Miscellaneous manufactured articles | 8 | 2.4 | 1 | 0.3 | 39 | 14.8 | 9 | 1.9 | 2 | 0.3 |
| 84. Articles of apparel and clothing accessories | 39 | 14.8 | 1 | 0.2 | 2 | 0.2 | ||||
| 87. Instruments and apparates n.e.s. | 6 | 1.8 | ||||||||
| 88. Photographic equipment,optical goods etc. | 8 | 1.8 | ||||||||
| 89. Miscellaneous manufactured articles,n.e.s. | 2 | 0.6 | 1 | 0.3 | 1 | 0.1 | ||||
| 9. Goods not classified elsewhere | 1 | 0.2 | 1 | 0.3 | 1 | 0.2 | 1 | 0.1 | 1 | 0.1 |
| 93. Special transactions and commodities not classified | 1 | 0.2 | 1 | 0.3 | 1 | 0.2 | 1 | 0.1 | 1 | 0.1 |
| All groups combined | 340 | 100.0 | 252 | 100.0 | 261 | 100.0 | 450 | 100.0 | 757 | 100.0 |
| Classification | Description | Year level | Quarter level | Month level | |
|---|---|---|---|---|---|
| SITC | Standard International Trade Classification (classification system is maintained by the United Nations) | ███ | ███ | ||
| BEC | The standard of statistical classification of BEC (Broad Economic Categories) is upheld by the UN and it is based on SITC-nomenclature. | ███ | ███ | ||
| NACE | National industrial classification based on Statistical Classification of Economic Activities in the European Community Nomenclature générale des Activités économiques dans les Communautés européennes | ███ | ███ | ||
| CPA | CPA = Classification of Products by Activities | ███ | ███ | ||
| CN | The Combined Nomenclature is the common nomenclature of the European Community. | ███ | ███ |